. 2022 Mar 11;11:e76595. doi: 10.7554/eLife.76595

Figure 5. Hydrogen to deuterium exchange by NMR for activating H-Ras mutants.

(A) Schematic of expected backbone hydrogen to deuterium exchange (HDX) over time when lyophilized protein is resolubilized in D2O. (B) Structure displaying the four H-Ras mutants analyzed by HDX and the residue measured in C. PDB ID: 5P21 (Pai et al., 1990). (C) Integrated peak volume change over time for the Lys 147 for wild-type H-Ras1-166 (WT), Y157Q, and Q99A samples. The line represents a single-exponential fit, from which the time-constant can be converted to exchange rate. (D) Fold change in exchange time (kobs,mutant/kobs,WT) plotted onto the WT structure of H-Ras. The mutated sites are highlighted in yellow. Backbone is colored at positions where both WT and mutant exchange could be measured in order to determine fold change. This fold change is represented on the scale reflected at the bottom of the panel. Dark blue color represents a mutant exchange less than three times slower than WT, light blue color between a two and three times slower, white between two times slower and two times faster, light red color between two and three times faster, and dark red color greater than three times faster.

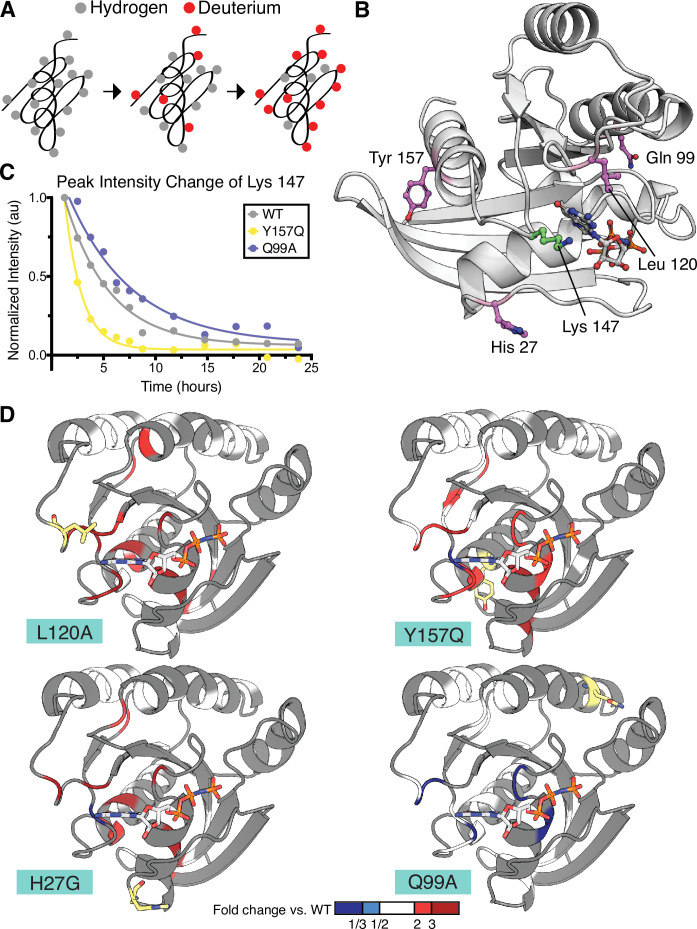
Figure 5.

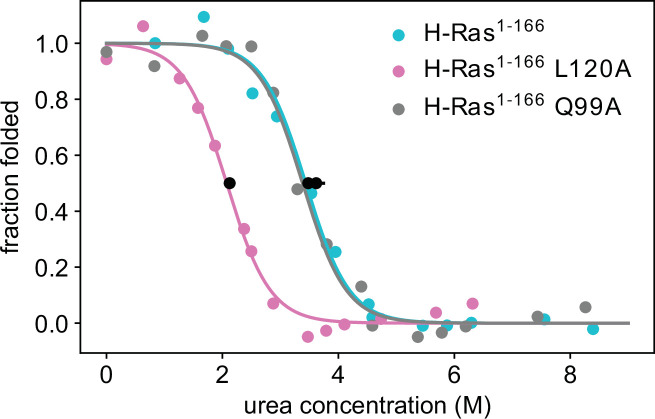
Figure 5—figure supplement 1. Thermodynamic stability measurements of L120A and Q99A.

Figure 5—figure supplement 1.

Pulse proteolysis measurements of H-Ras1-166 L120A and Q99A variants, as well as new replicates of the wild-type construct. The values of the unfolding free-energy change (ΔGunf) are 14.0 ± 0.3 kJ⋅mol-1, 23.0 ± 0.7 kJ⋅mol-1 and 23.9 ± 1.0 kJ⋅mol-1, respectively. The proteolysis experiments were conducted at 25 °C, using 100 μM GDP and 1.6 μM Ras.
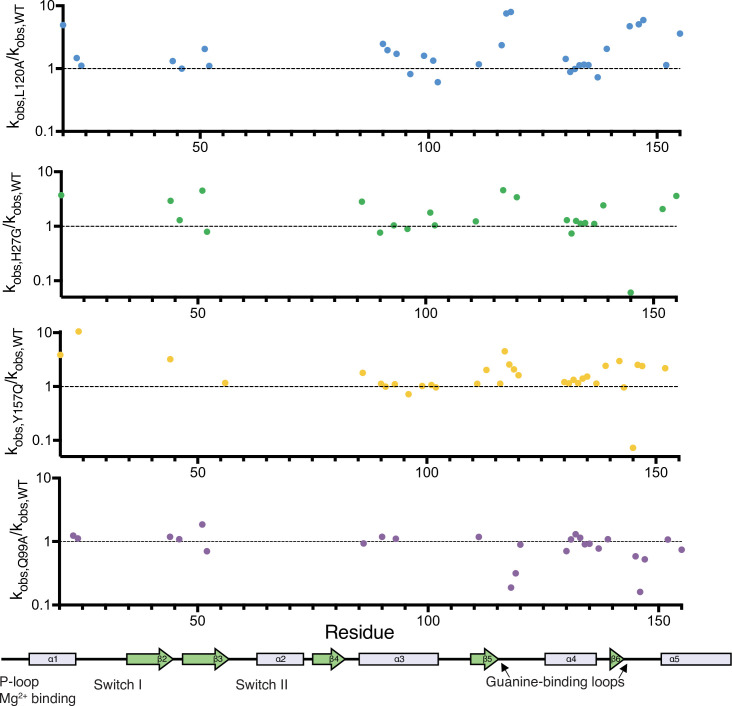
Figure 5—figure supplement 2. Relative change in hydrogen to deuterium exchange for each mutant.

Figure 5—figure supplement 2.

Relative exchange (kobs,mutant/kobs,WT) plotted over residue number. A map of the secondary structural elements is aligned at the bottom. The structural overlay of the same data can be seen in Figure 5D.
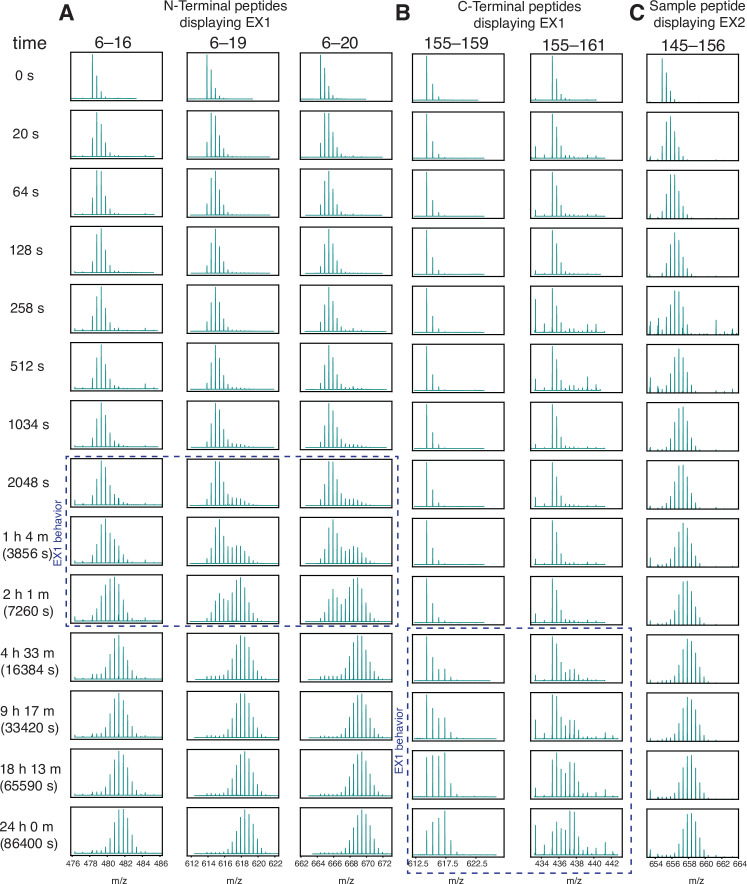
Figure 5—figure supplement 3. Wild-type H-Ras exhibits EX1 behavior at the N and C terminus.

Figure 5—figure supplement 3.

HDX was measured by mass spectrometry. Reactions were quenched at different time points from time 0 to 24 hr and the protein was digested. Peptide m/z (residue numbers labeled at the top of each column) is plotted inside each box. (A) N-terminal peptides show bimodal exchange (indicative of EX1 behavior) from timepoints 2048 s to 2 hr. (B) C-terminal peptides show EX1 behavior from 4.5 hr to 24 hr. (C) Sample peptide showing EX2 behavior.