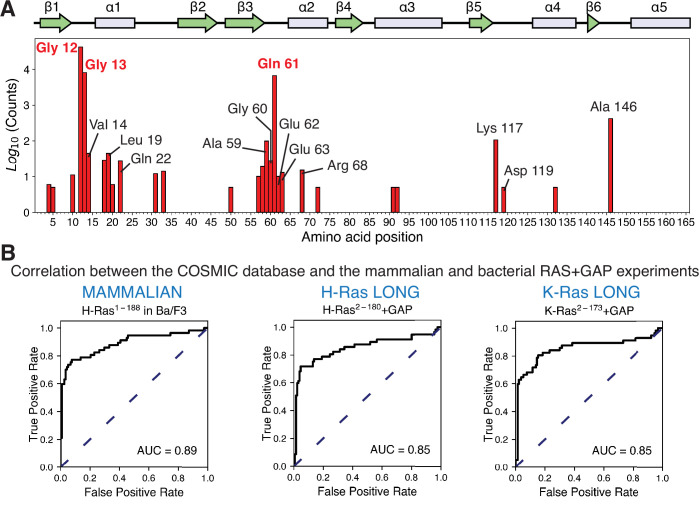
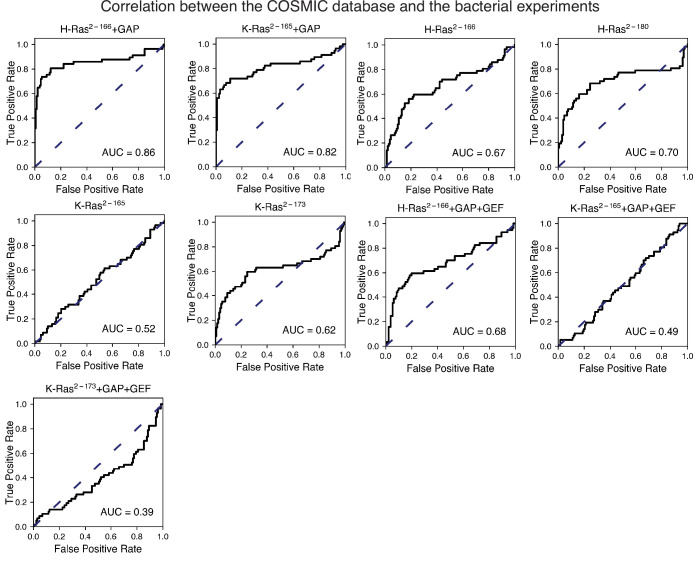
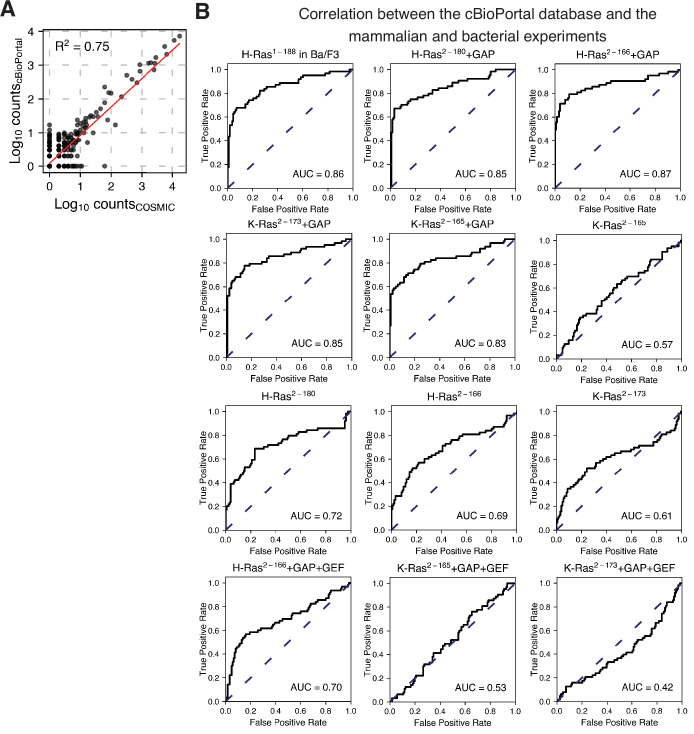
Figure 6. Prediction of the cancer mutations by the mammalian Ba/F3 cell and Ras+GAP experiments.
(A) Counts per residue of Ras variants that appear in the COSMIC v94 database and pass the five-count cutoff (Tate et al., 2019). There are twenty-eight residues where at least one mutation is present five or more times: residues 4, 5, 10, 12, 13, 14, 18, 19, 20, 22, 31, 33, 50, 57, 58, 59, 60, 61, 62, 63, 68, 72, 91, 92, 117, 119, 132, and 146. (B) ROC analysis of the H-Ras1-188 in mammalian Ba/F3 cells, H-Ras2−180+GAP, and K-Ras2−173+GAP datasets. For a given threshold enrichment value, we count a mutation as activating if its enrichment value is greater than the threshold. If an activating mutation is present in the COSMIC database five or more times, we count the prediction as a true positive. Mutations found in the gnomAD database are used as true negatives (Karczewski et al., 2020). The full list of mutations used in the analysis is provided in the Github repository.


