
Figure 4.
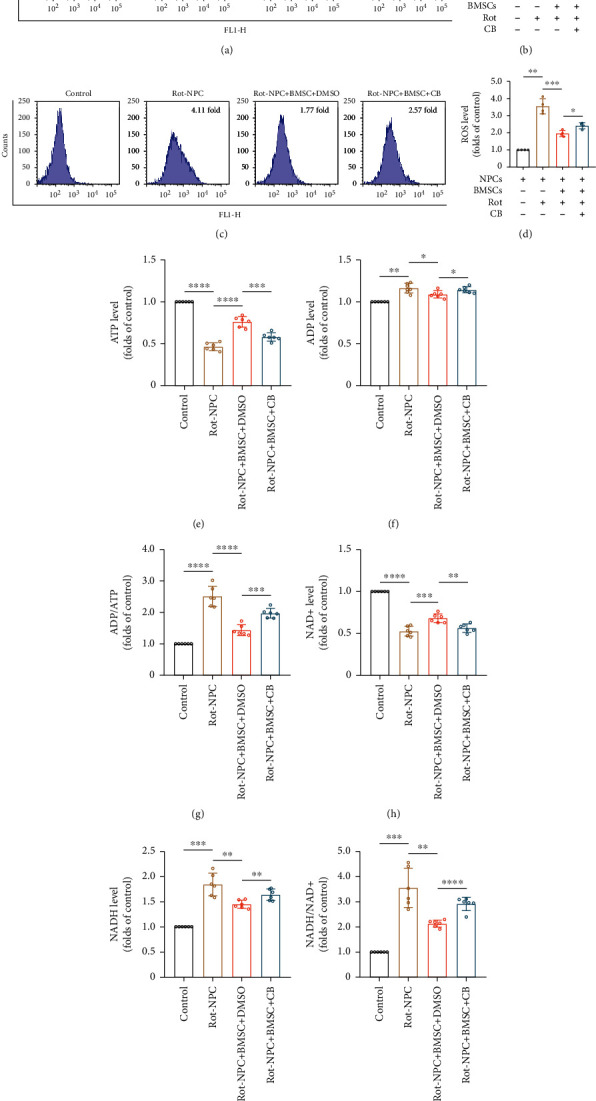
Mitochondrial transfer improves mitochondrial dysfunction in NPCs. (a) Flow cytometric analysis of mitochondrial membrane potential in NPCs. (b) Histogram showing the mitochondrial membrane potential. Means ± SD, n = 4. (c) Flow cytometric analysis of ROS levels in NPCs. (d) Relative levels of intracellular ROS. Means ± SD, n = 4. (e–g) Histogram showing the ATP, ADP, and ADP/ATP levels in NPCs. (h–j) Histogram showing the levels of NAD+, NADH, and NADH/NAD+ in NPCs. Means ± SD, n = 6. ∗P < 0.05, ∗∗P < 0.01, ∗∗∗P < 0.001, and ∗∗∗∗P < 0.0001. BMSCs: bone marrow mesenchymal stem cells; CB: cytochalasin B; NPCs: nucleus pulposus cells; rot: rotenone.