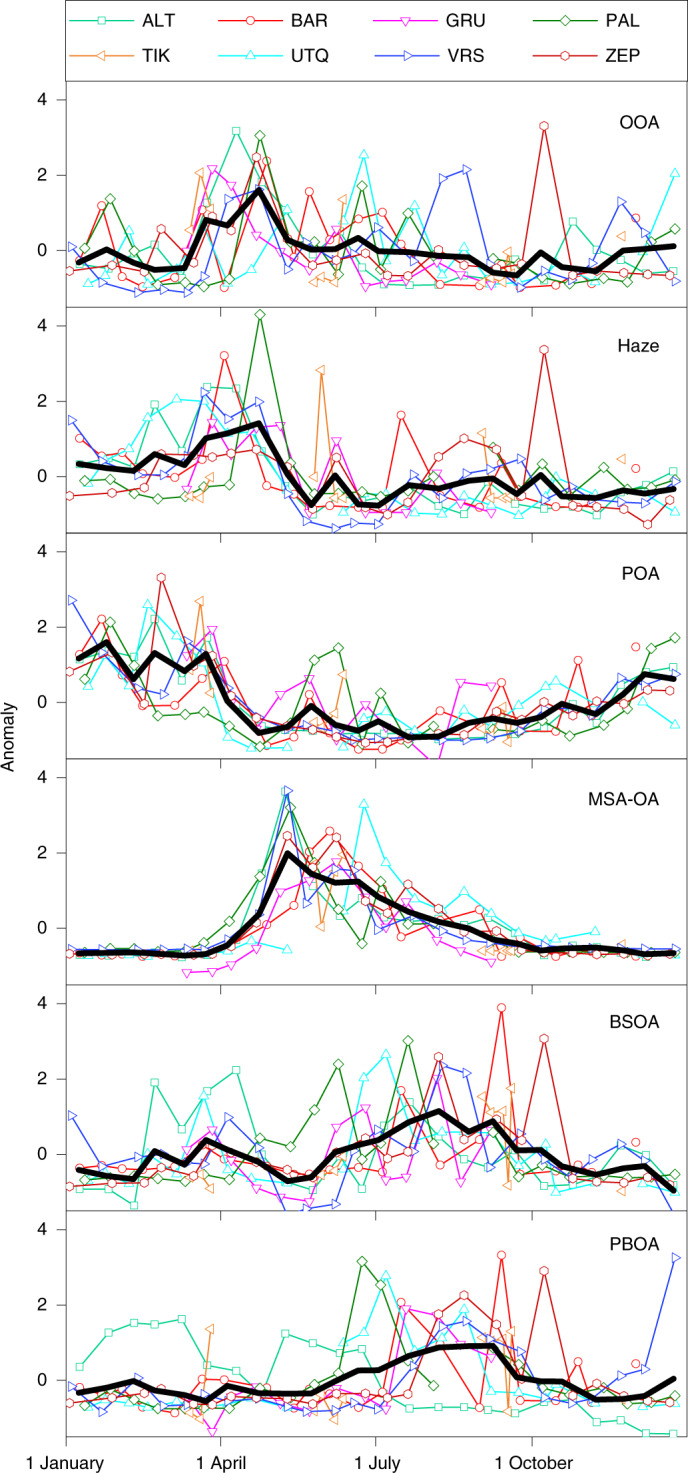
Fig. 3. Seasonal variability of speciated pan-Arctic OAs.

Standardized annual cycles for each OA factor at the different stations. Bi-weekly averaged data from multiple years for each station are merged into a single annual cycle (the sum of individual station values in each panel equals zero). The y-axis values (anomalies) were calculated using the absolute mass concentration values as: (value – station average)/s.d. of station. The thick black lines indicate the average annual cycle of each factor over all the stations (note that here the sum of the yearly values in each panel is not equal to zero).
