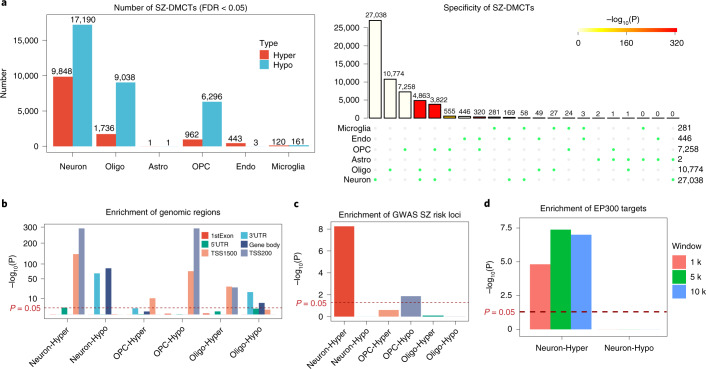
Fig. 4. Application of the brain DNAm-atlas to an EWAS of schizophrenia.
a, Bar plots display the number of cell-type-specific SZ-associated DMCTs, as inferred using CellDMC in an EWAS of SZ performed in the prefrontal cortex. Upset plot (right) displays the overlap of DMCTs between cell types. P value was computed from a one-tailed Fisher’s exact test of multiple-set intersections. b, Enrichment of regulatory regions among DMCTs displaying only those cell types (neurons, oligodendrocytes and OPCs) with sufficient numbers of DMCTs. P value was computed from a one-tailed Fisher’s exact test. c, Enrichment of SZ-associated GWAS loci among the DMCTs displayed in f. P values were estimated using a one-tailed Fisher’s test. d, Enrichment of EP300 ChIP-seq targets among neuron DMCTs and for three different choices of window size (1 kb, 5 kb, 10 kb). P values were estimated using a one-tailed Wilcoxon rank-sum test comparing binding intensity of neuron-DMCT genes against the binding intensity of genes not linked to DMCTs.

