
Figure 2:
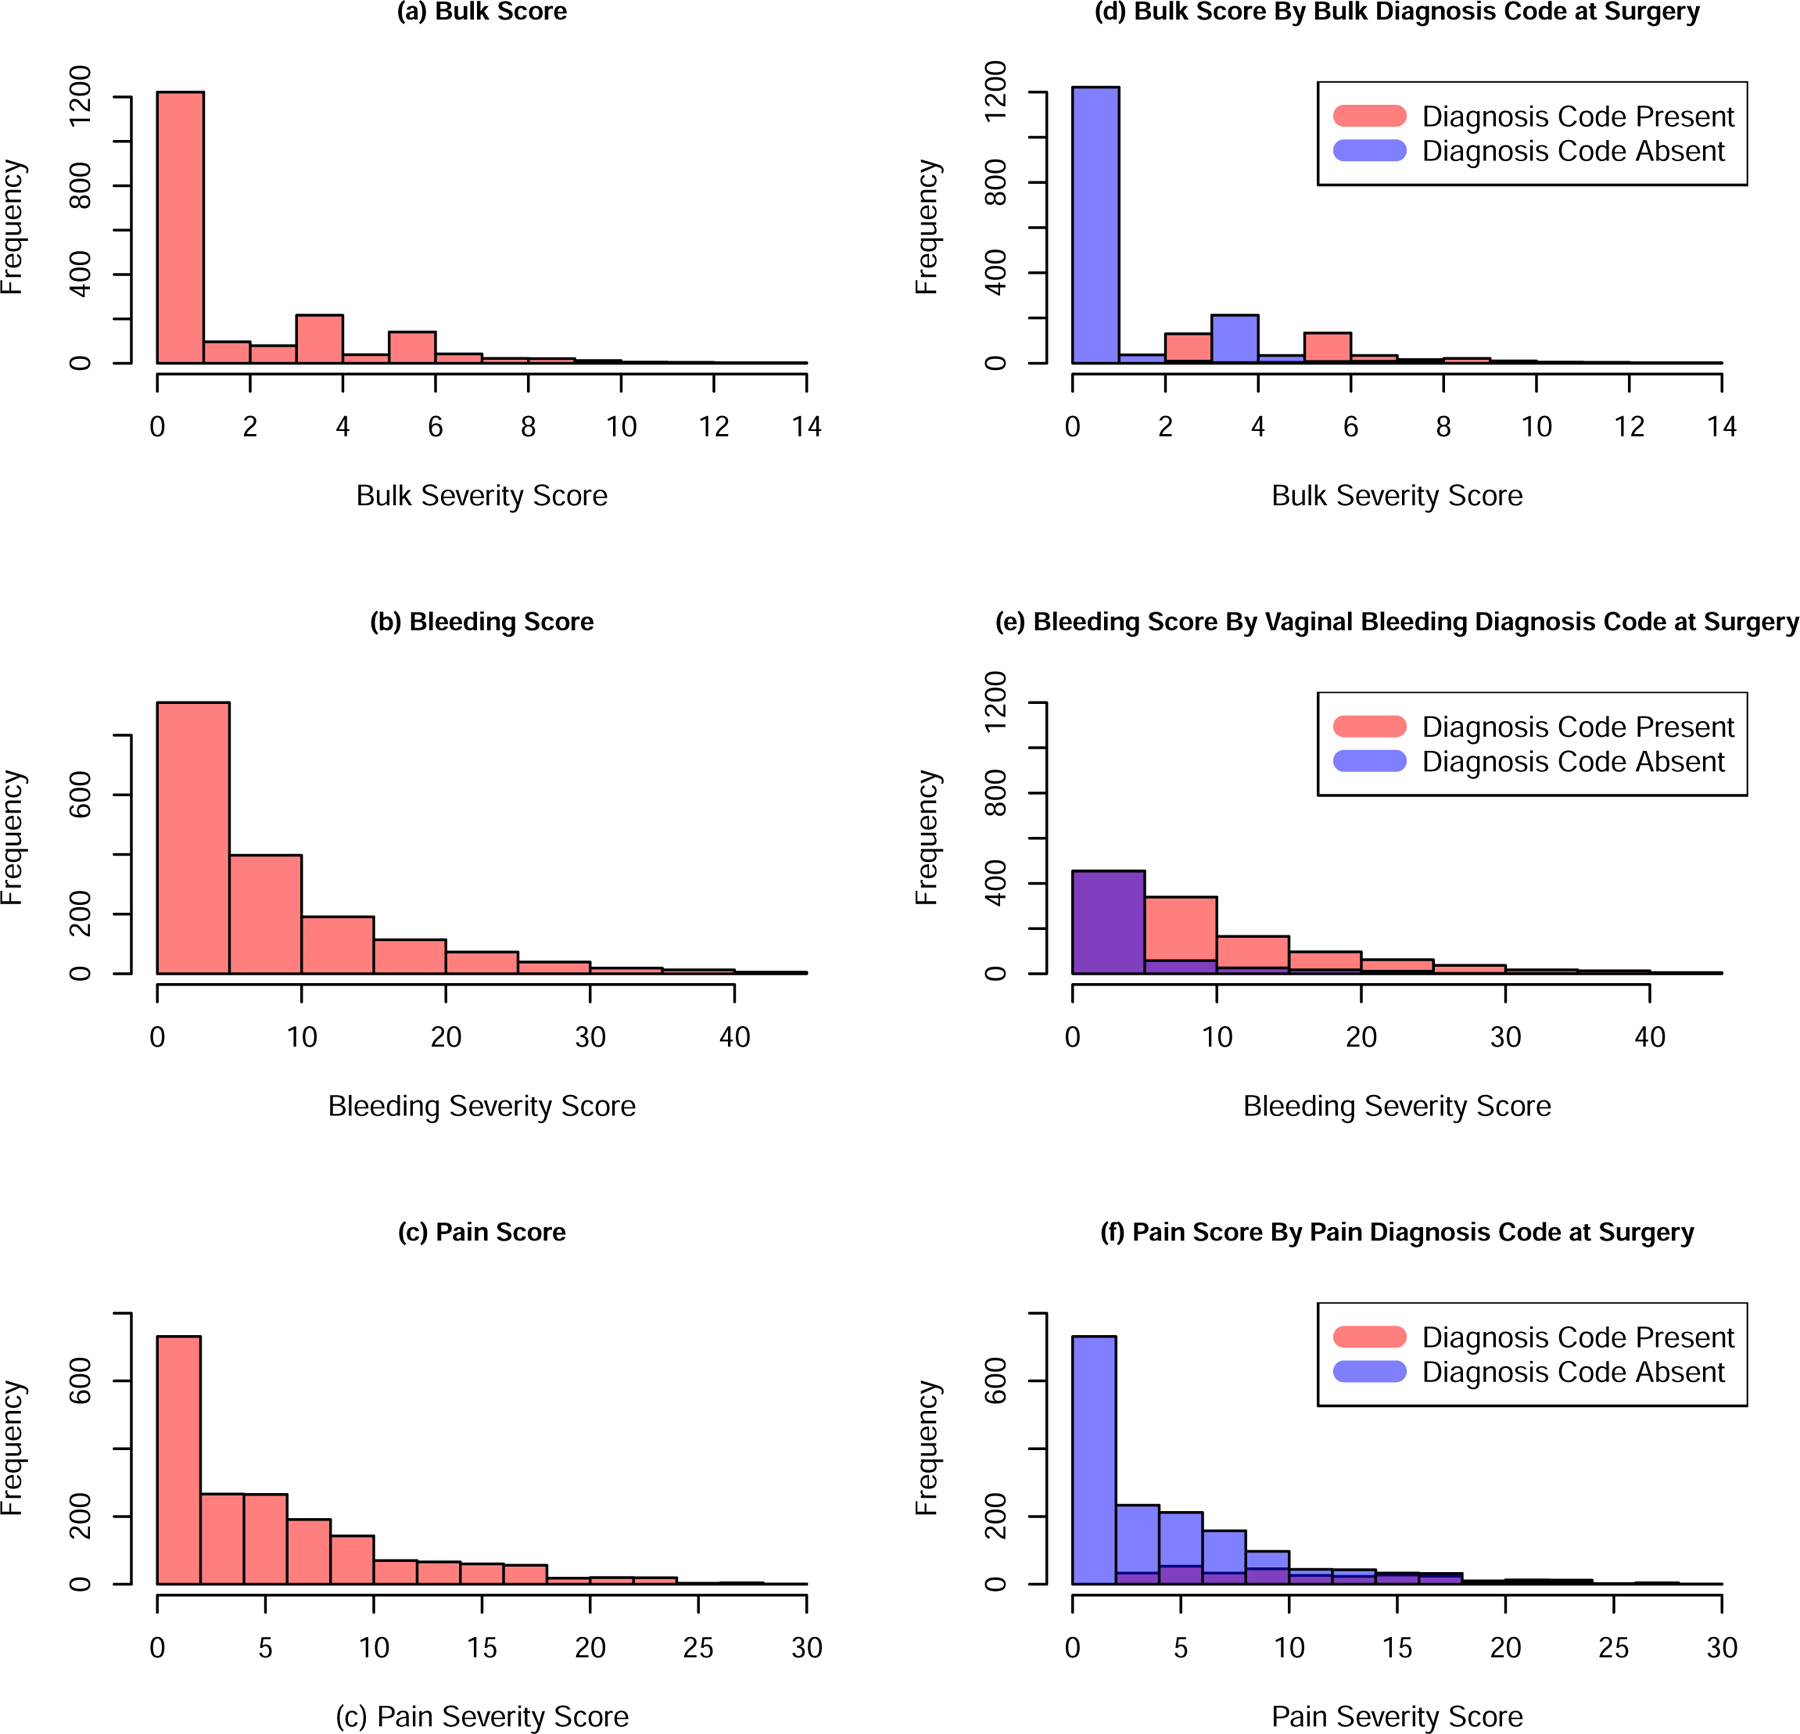
Distribution of Final Composite Symptom Severity Index Scores for Bulk (a), Bleeding (b) and Pain (c) and Final Composite Symptom Severity Index Scores for Bulk (d), Bleeding (e) and Pain (f) Severity Scores stratified by Diagnosis Codes Present (red) or Absent at Surgery (blue). Please note the purple color results from overlapping data.