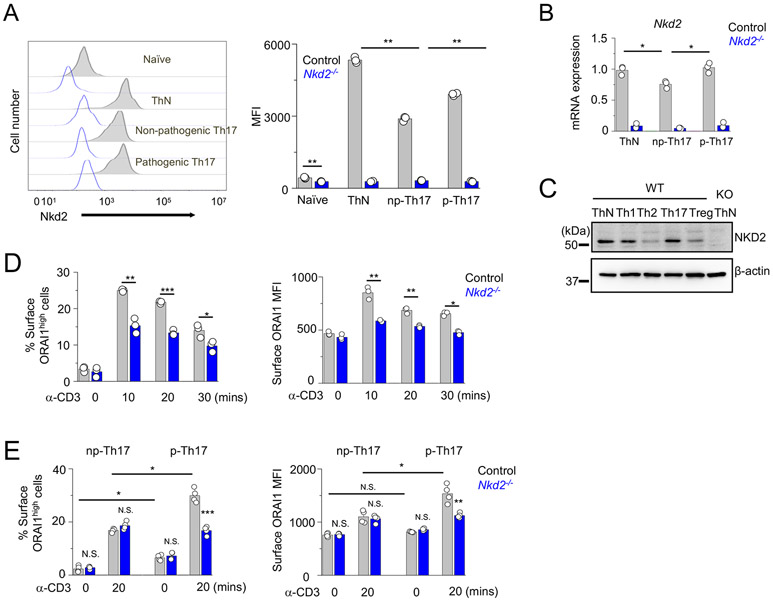
Figure 2. NKD2 is abundantly expressed in Th1 cells and those polarized under pathogenic Th17-polarizing conditions.
(A) Representative histogram showing NKD2 expression in naïve and effector T cells cultured under non-polarizing (ThN), non-pathogenic Th17-polarizing (np-Th17), and pathogenic Th17-polarizing (p-Th17) conditions (left). Nkd2−/− T cells (open blue histograms) were used as a negative control for staining. The bar graph (right) shows average mean fluorescence intensities (MFIs ± s.e.m.) of NKD2+ population. Each symbol represents data from an independent staining.
(B) Control and Nkd2−/− naïve T cells were cultured under non-polarizing conditions or under non-pathogenic or pathogenic Th17-polarizing conditions (see methods for details). Four days after differentiation, cells were harvested for transcript analysis of Nkd2. Data show representative triplicates from two independent experiments.
(C) Representative immunoblot showing NKD2 expression in lysates of primary murine effector T cells of indicated lineages. Lysates of Nkd2−/− cells were loaded to show specificity of the antibody. β-actin - loading control. Th17 – T cells cultured under pathogenic Th17-polarizing conditions.
(D) Control and Nkd2−/− T cells were differentiated under non-polarizing conditions and transduced to express ORAI1-EC-HA that contains an HA tag in the extracellular domain. Cells were stained with anti-HA antibodies without permeabilization to label plasma membrane-localized ORAI1 at indicated time points after TCR stimulation. Data shows the average (± s.e.m.) frequencies (left) or MFIs (right) from three independent experiments.
(E) Control and Nkd2−/− T cells cultured under non-pathogenic or pathogenic Th17-polarizing conditions and transduced to express ORAI1-EC-HA were stained with anti-HA antibodies without permeabilization to label plasma membrane-localized ORAI1 at indicated time points after TCR stimulation. Data shows average (± s.e.m.) frequencies (left) or MFIs (right) from three independent experiments.
* p<0.05, ** p<0.005, *** p<0.0001.

