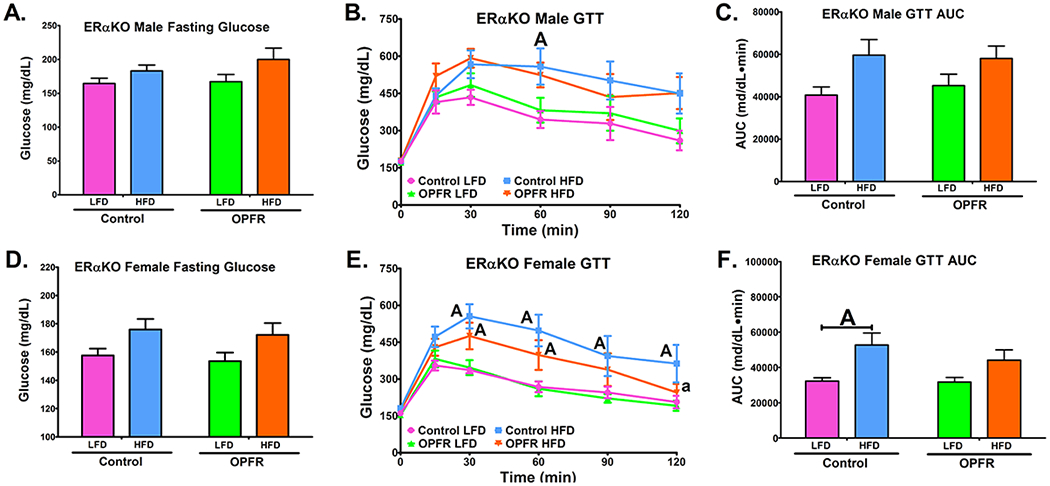
Figure 6.

Glucose tolerance tests in ERαKO mice orally dosed with an OPFR mixture (1 mg/kg bw) for ~6 weeks. (A) Male fasting glucose; (B) Male GTT; (C) Area under the curve (AUC) of Male GTT; (D) Female fasting glucose; (E) Female GTT; (F) Area under the curve (AUC) of Female GTT. Data were analyzed by a two-way ANOVA (A, C, D, F) or a repeated-measures, three-way ANOVA (B, E) with post-hoc Newman-Keuls multiple comparisons test. Uppercase letters denote diet effects within exposure group and lowercase letters denote OPFR effect within diet group. Data (n=5-8 for all groups) are presented as mean ± SEM.
