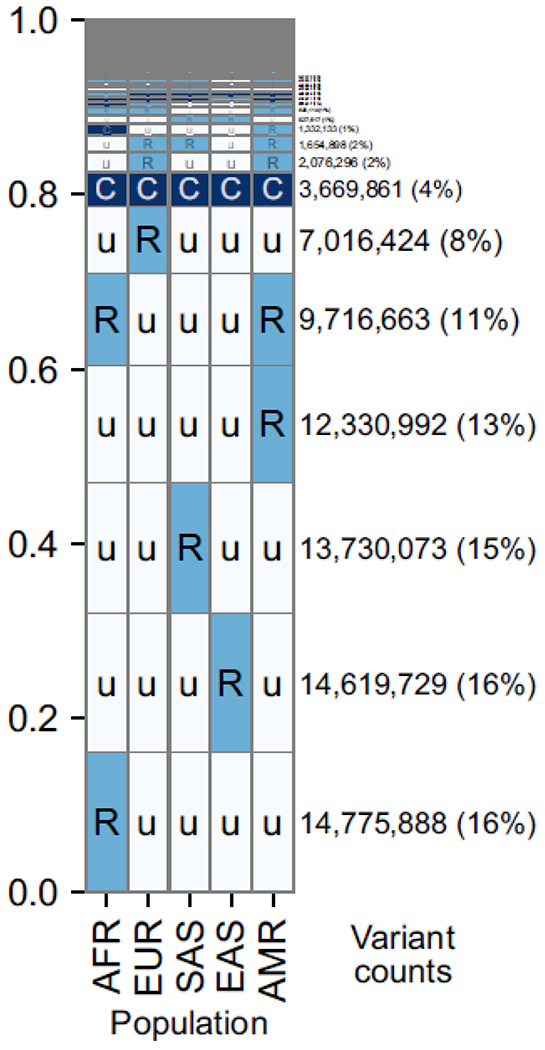
Figure I. Most common human alleles have a broad geographic distribution.

Data are summarized across ~92 million bi-allelic variants from 1000 Genomes. Within each cell, C = common (>5% frequency), R = rare (<5%), u= unobserved (0%). The number and proportion of variants with a given geographical distribution is indicated by the text on the right, as well as the height of the row. AFR=African, EUR=European, SAS=South Asian, EAS=East Asian, AMR=Admixed American. Reproduced from [10].
