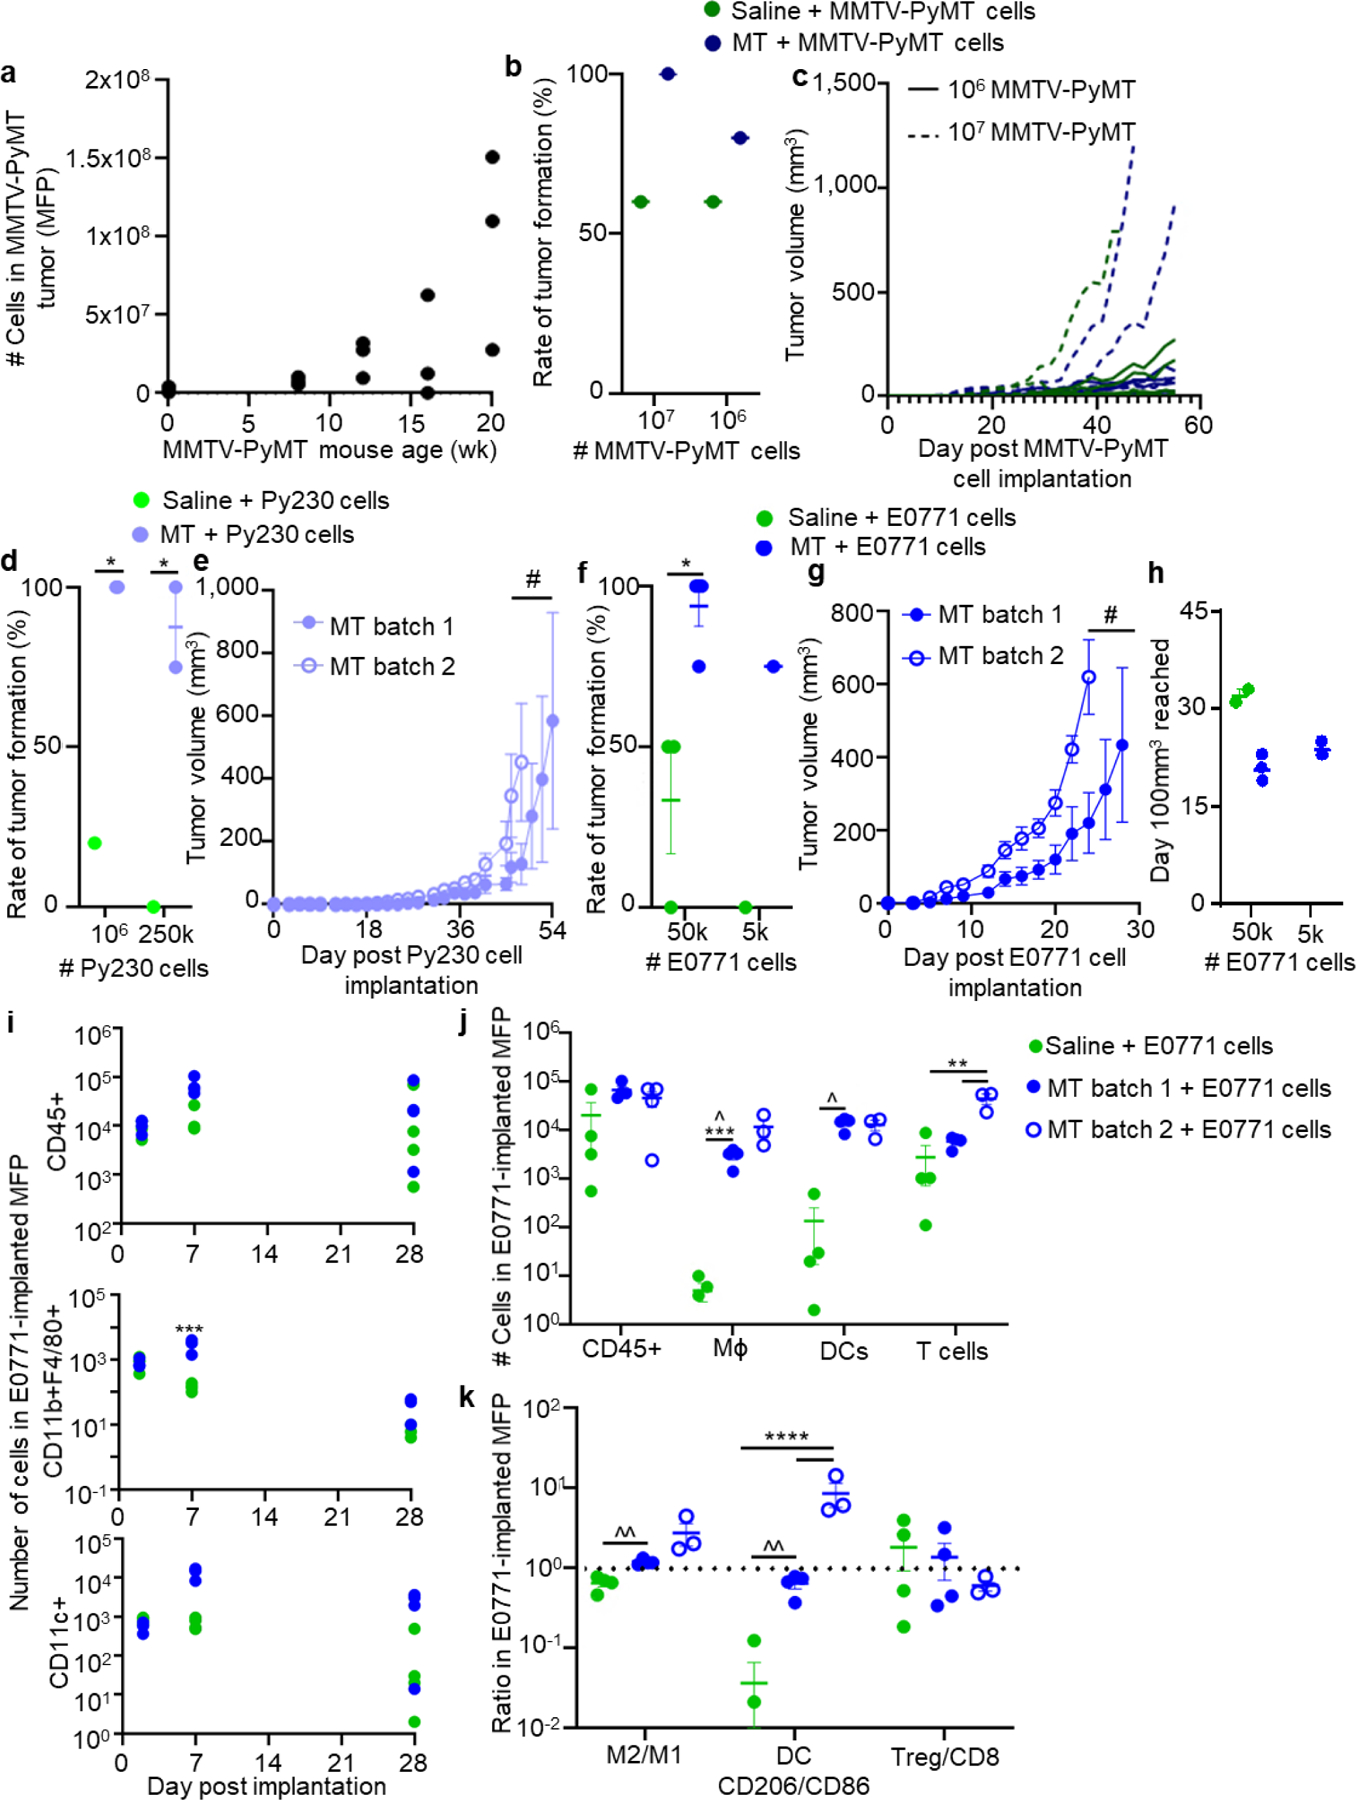
Figure 1. Current preclinical models of breast cancer are insufficient.

(a) Number of total cells in excised MMTV-PyMT tumors at week 8, 12, 16, and 20, and wild-type animals (week 0). a, each point represents one mouse. Rate of tumor formation (b) and tumor volume (c) after implantation of varying numbers of cells derived from MMTV-PyMT tumors into mammary fatpad (MFP) of C57/Bl6 mice. b, each point represents one experiment with n=5 mice. c, each line represents the growth curve of one tumor implanted in the MFP a mouse, n=5 per group. Rate of tumor formation (d) at two total Py230 cell doses, and tumor growth curves (e) of 250,000 Py230 cells implanted in the MFP of C57Bl6 mice in either saline and Matrigel (MT). d, each point represents one experiment with n=4–10 animals. e, data represents mean ± s.e.m. with n=5 animals implanted with one tumor. Rate of tumor formation (f) at two total E0771 cell doses, and tumor growth curves (g) and time until tumors reached 100 mm3 (h) of 50,000 E0771 cells implanted in the MFP of C57/Bl6 mice in either saline and MT. f, each point represents one experiment with n=4 animals. g, data represents mean ± s.e.m. with n=4 animals implanted with one tumor. h, each data point represent one tumor implanted animal. (i) Number of total lymphocytes (CD45+), macrophages (CD11b+F4/80+), and dendritic cells (CD11c+) at various times post implantation of 50,000 E0771 tumor cells in saline or MT into the MFP of C57Bl6 mice. Each data point represents one tumor implanted animal. Number of total lymphocytes (CD45+), macrophages, dendritic cells, and T cells (j) and phenotype of macrophages, DCs, and T cells (k) at day 7 after 50,000 E0771 cells were implanted in the MFP of C57Bl6 mice in saline or two different batches of MT. Each data point represents one tumor implanted animal. * indicates significance by two-way ANOVA (b) or mixed-effects analysis (d, f, i, j, k) with Tukey’s post-hoc comparison; # indicates significance by RM ANOVA with Tukey’s post-hoc comparison; ^ indicates significant difference in variance by Brown-Forsythe’s test. *, #, ^ indicate p<0.05, **, ^^ indicate p<0.01, *** indicates p<0.005, **** indicates p<0.001.
