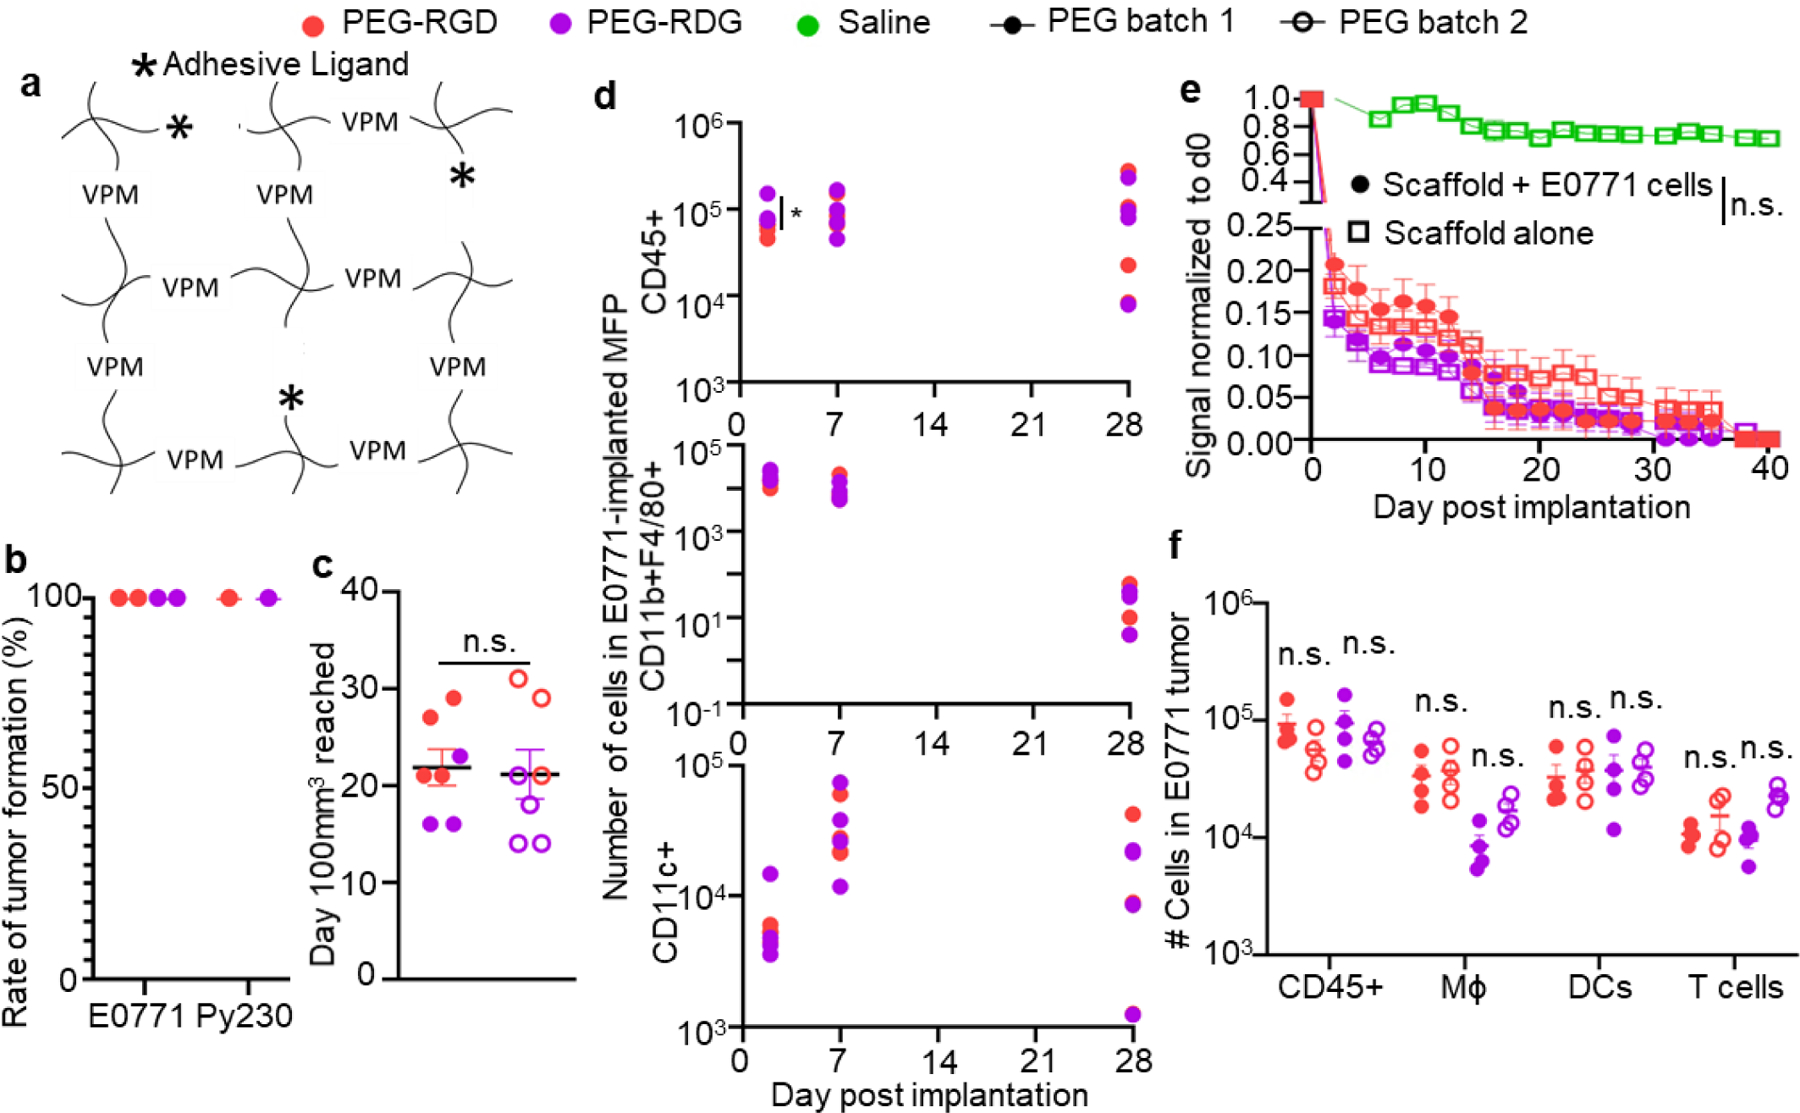
Figure 2: Engineered hydrogels induce consistent and controllable tumor immune microenvironments.

(a) Schematic diagram of hydrogels consisting of PEG-4MAL, with VPM crosslinkers, and adhesive ligands (stars). Tumor formation (b) and growth (c) rate after implantation of 50,000 E0771 cells into C57Bl6 mice in PEG hydrogel matrix vehicle. b, each point represents one experiment with n=4 mice. c, measured as time to 100mm3 in tumor volume. Each data point represents one tumor implanted animal. (d) Number of total lymphocytes (CD45+), macrophages (CD11b+F4/80+), and DCs (CD11c+) within tumor various times post implantation of 50,000 E0771 cells into C57Bl6 mice in PEG hydrogel matrix vehicle. Each point represents one animal. (e) Degradation of AF750-labelled PEG matrix vehicle implanted into C57Bl6 mice relative to d0 signal, measured by IVIS imaging, with or without co-implantation of 50,000 E0771 cells. Data represents mean ± s.e.m. with n=6 animals implanted with one tumor. (f) Number of total lymphocytes (CD45+), macrophages, dendritic cells, and T cells within tumor day 7 post implantation of 50,000 E0771 cells into C57Bl6 mice in two separate PEG hydrogel matrix vehicle batches prepared ~1 year apart. Each data point represents one tumor implanted animal. For all groups, error bars indicate mean ± s.e.m. * indicates significance by one-way ANOVA with Tukey’s post-hoc comparison; * indicates p<0.05, n.s. indicates not significant (p>0.05).
