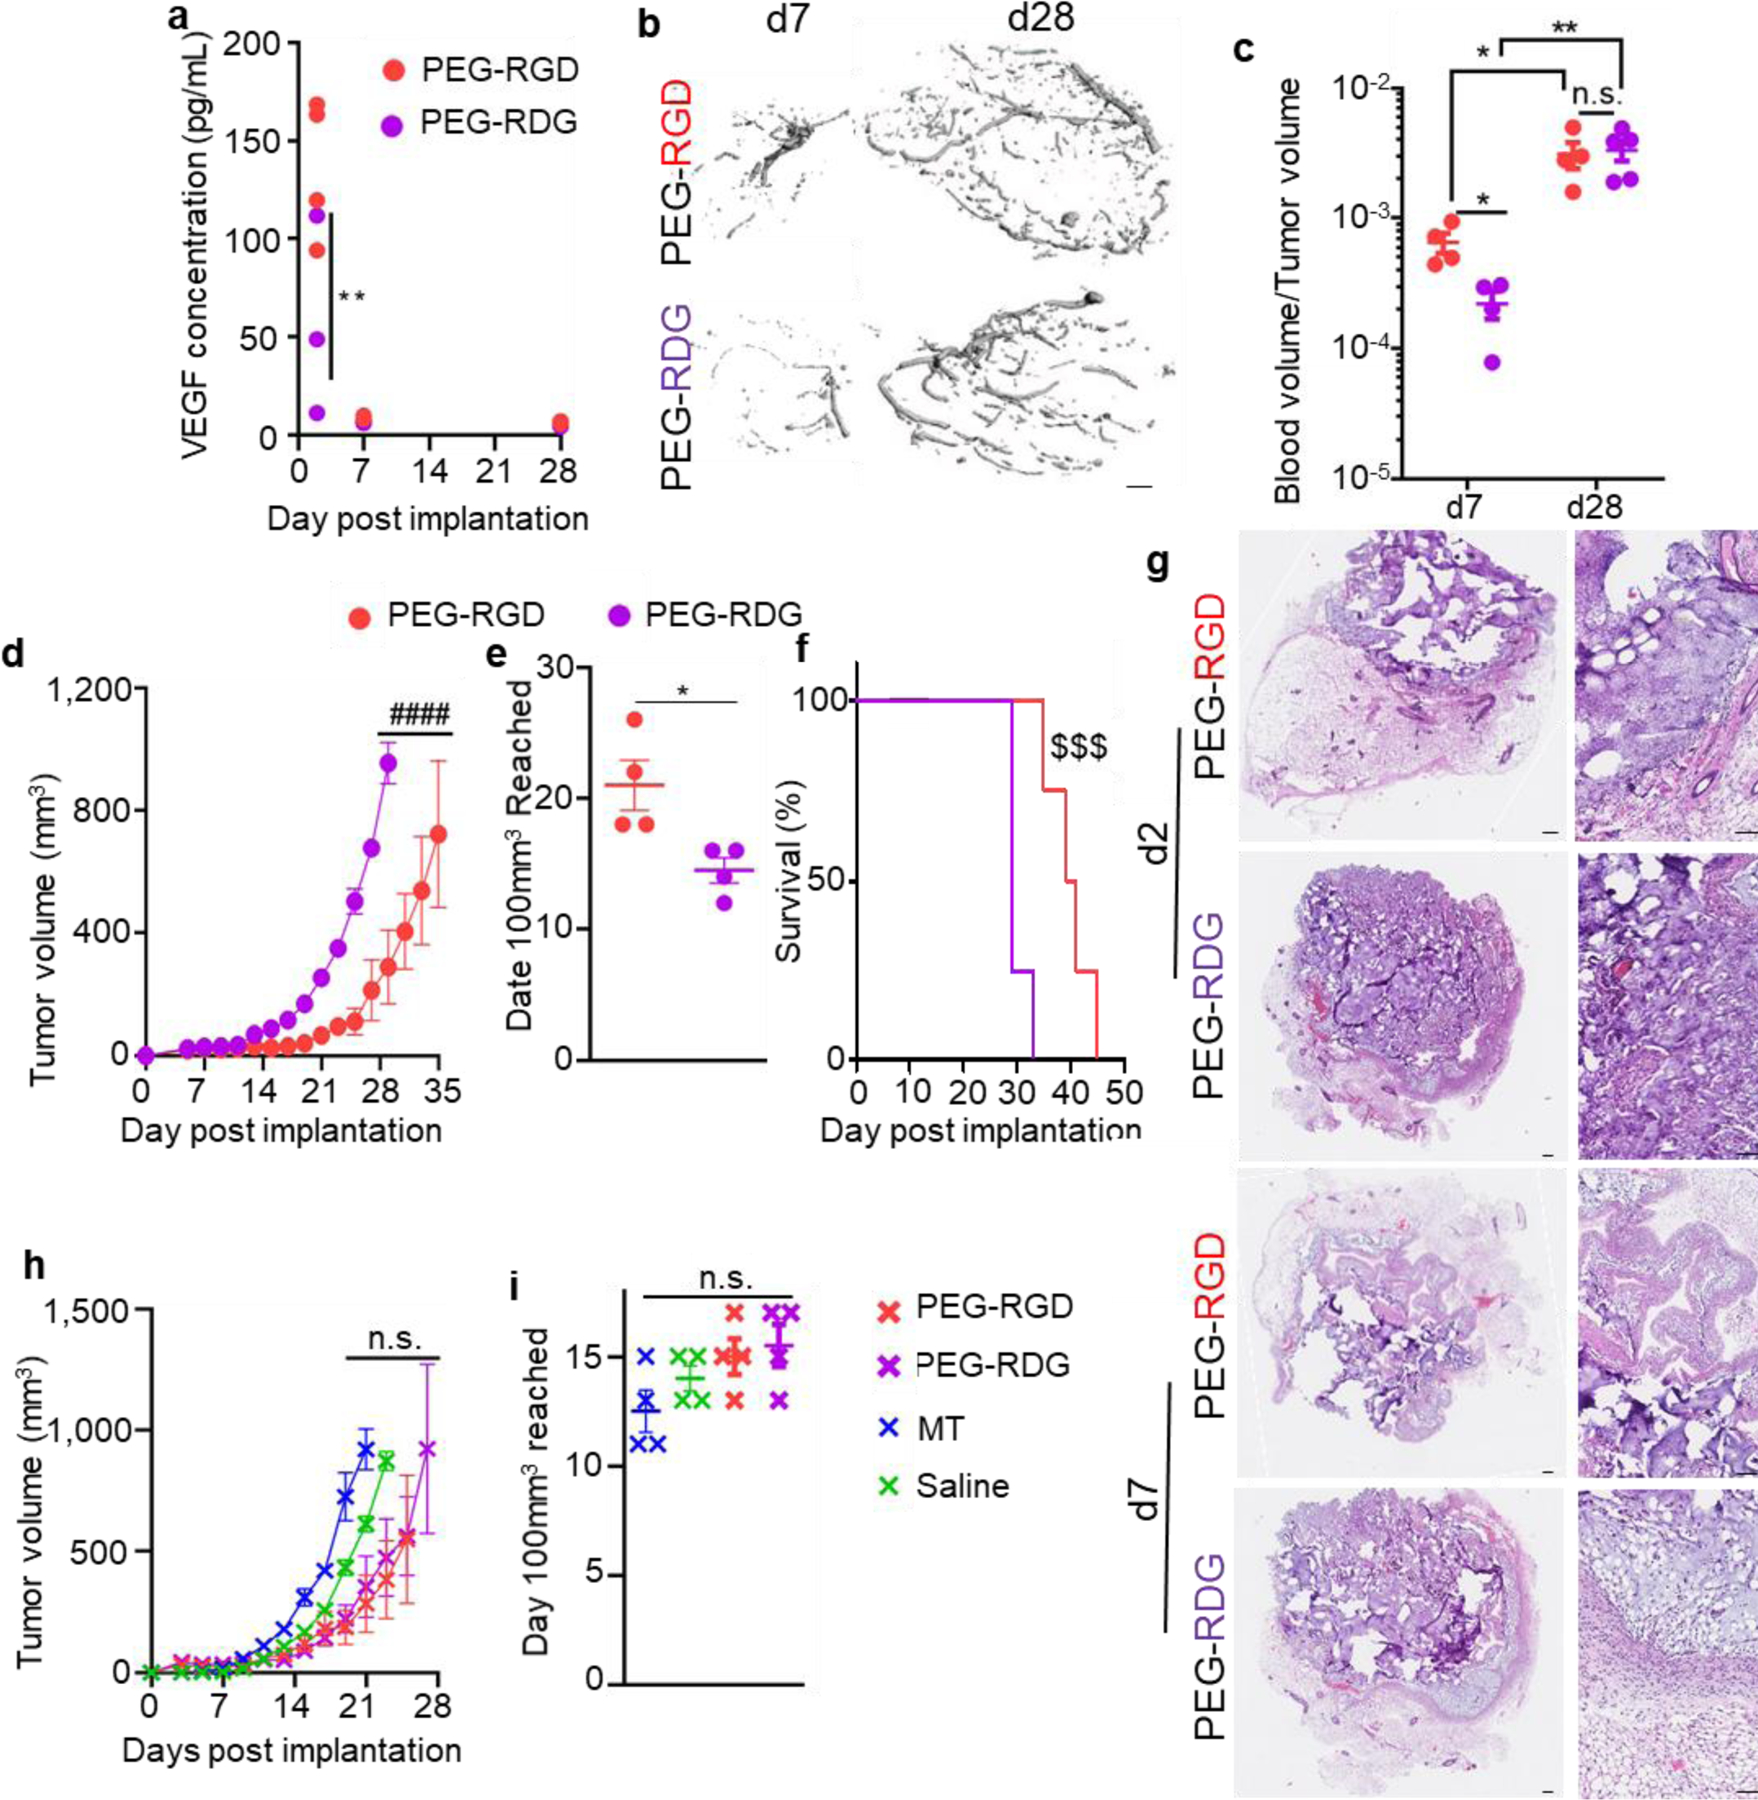
Figure 3: Adhesive ligands alter immune responses in tumors formed using engineered hydrogel matrix vehicles.

(a) VEGF-A concentration within tumors formed from 50,000 E0771 cells implanted in C57Bl6 mice in PEG hydrogel matrix vehicles at d2, 7, and 28 after implantation. Each data point represents one tumor implanted animal. Vasculature within tumors formed from 50,000 E0771 cells implanted in C57Bl6 mice in PEG hydrogel matrix vehicles, as measured by micro-computed tomography, visualized in (b) and quantified in (c). b, scale bar indicates 100μm. c, each data point represents one tumor implanted animal. Tumor growth curves (d), days until a tumor volume of 100mm3 was reached (e) and animal survival (f) after 50,000 E0771 cells were implanted in C57/Bl6 mice in PEG hydrogel matrix vehicles. d, data represent mean ± s.e.m. of n=4 tumors implanted into individual animals. e, each data point represents one tumor implanted animal. f, n=4. (g) Histological sections of tumors 2 and 7 days after implantation of 50,000 E0771 cells into C57/Bl6 mice in either PEG hydrogel matrix vehicle formulation. Images are representative of n=4 animals per group, scale bars represent 100μm. Tumor growth curves (h) and days until a tumor volume of 100mm3 was reached (i) after 50,000 E0771 cells were implanted into NSG mice in various matrix vehicle types. h, data represent mean ± s.e.m. of n=4 tumors implanted into individual animals. i, each data point represents one tumor implanted animal. * indicates significance by one-way ANOVA (i) or mixed-effects analysis (a, c) with Tukey’s post-hoc comparison, or Mann-Whitney test (e); # indicates significance by RM ANOVA with Tukey’s post-hoc test; $ indicates significance by Log-Rank test; * indicates p<0.05, ** indicates p<0.01, $ $ $ indicates p<.005, #### indicates p<0.001, n.s. indicates not significant (p>0.05).
