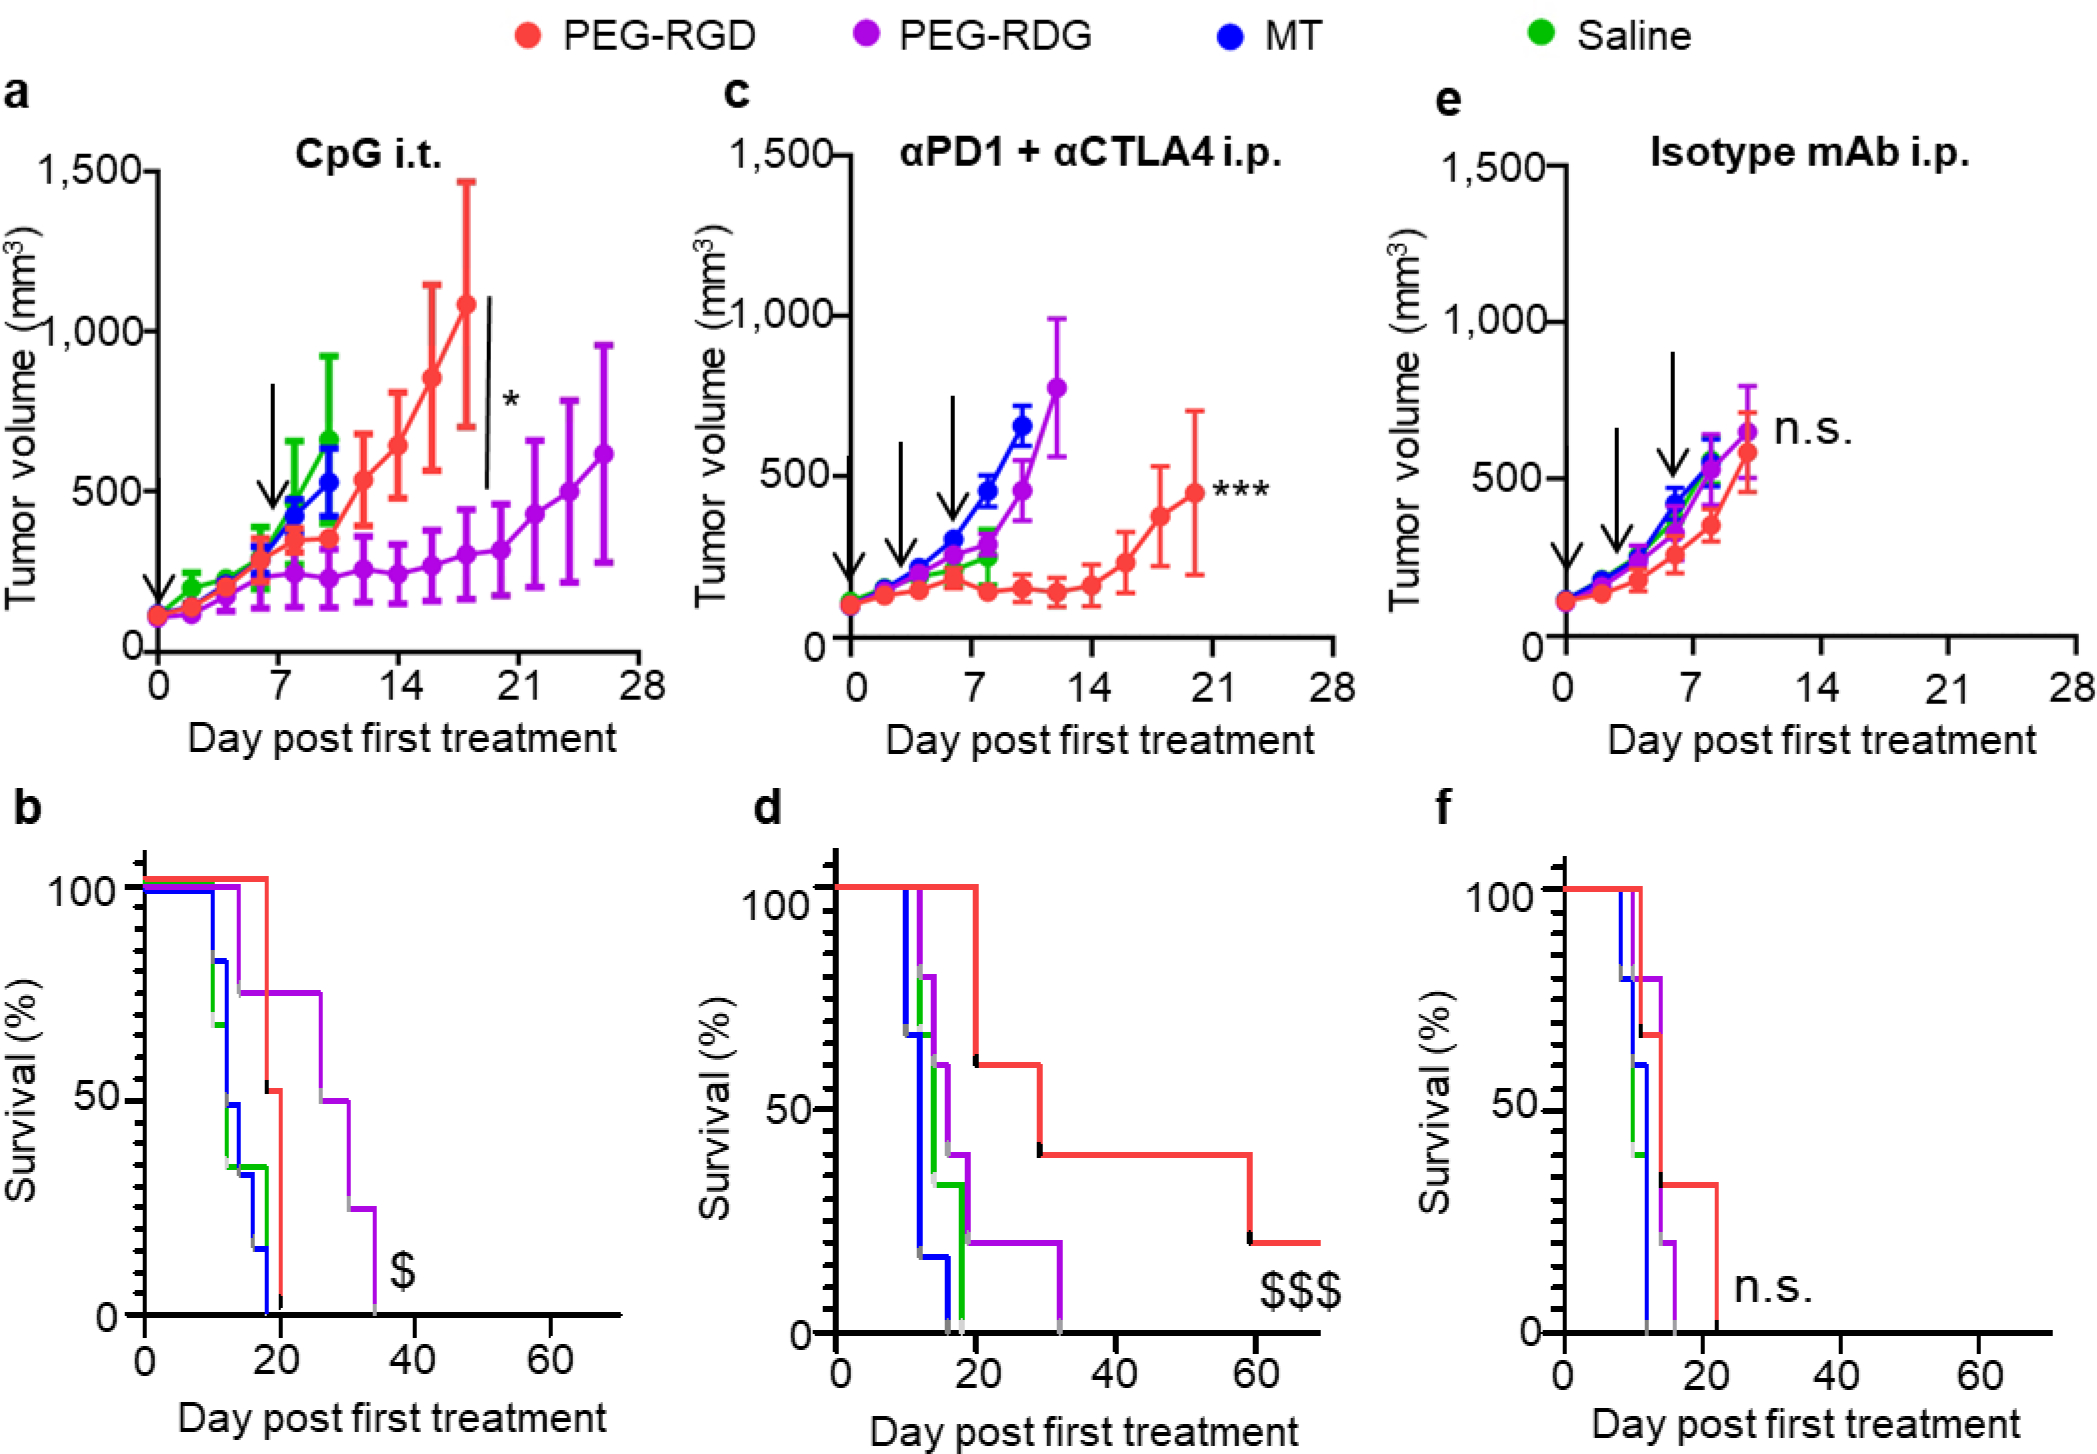
Figure 6: Tumor response to immunotherapy is dependent upon matrix vehicle.

Tumor growth curves (a, c, e) and animal survival (b, d, f) of C57Bl6 mice implanted with E0771 cells after CpG vaccine administered i.t. on day 0 and 7 (a-b), combination αPD1 + αCTLA4 mAb treatment administered i.p. on days 0, 3, and 6 (c-d), and isotype control mAb administered i.p. on days 0, 3, and 6 (e-f). a, c, e, data represent mean ± s.e.m. of n=5–7 tumors implanted into individual animals. d0 signifies the first day of treatment when tumors reached 100 mm3. Arrows indicate days therapy is given. * indicates significance by repeated measures ANOVA with Tukey’s post-hoc test, against all other groups if not specified; $ indicates significance against all other groups by log-rank test. a, b, e, and f are representative of two independent experiments; *, $ indicate p<0.05, ***, $ $ $ indicate p<0.005; n.s. indicates not significant (p>0.05).
