
Figure 3.
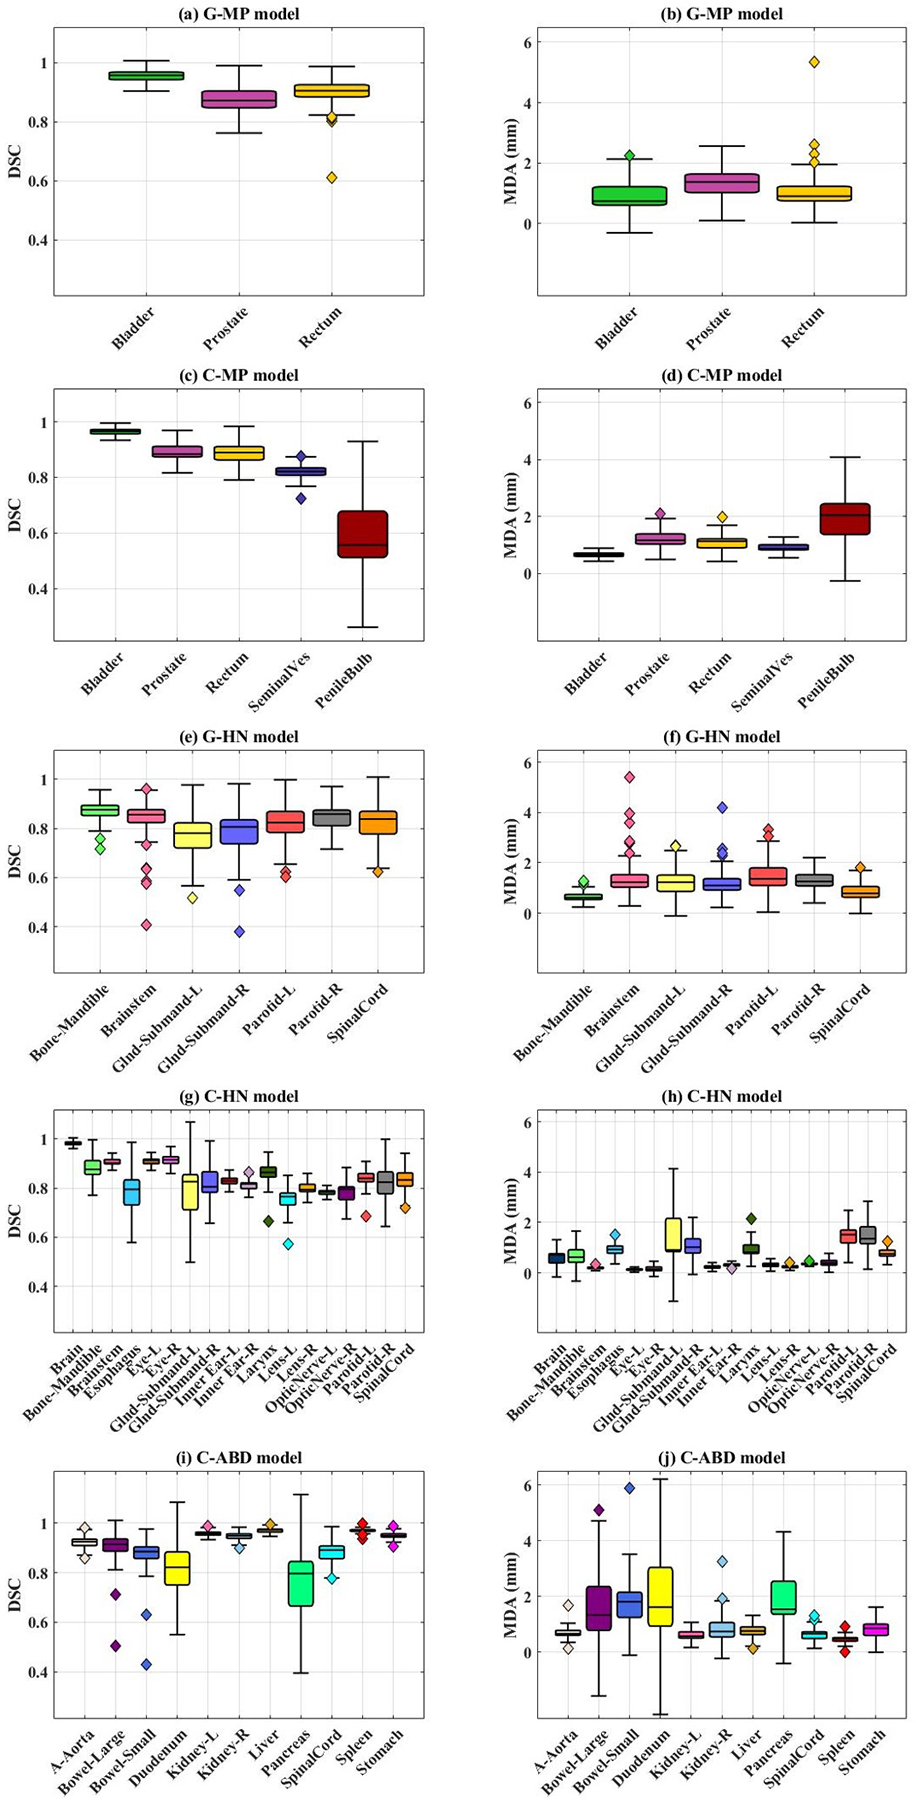
Accuracy metrics, 3D average dice similarity coefficient (DSC) and mean distance to agreement (MDA) for all 5 models are shown. a-b) General male pelvis (G-MP) model; c-d) general head and neck (G-HN) model; e-f) custom male pelvis (C-MP) model; g-h) custom head and neck (C-HN) model; i-j) custom abdomen (C-ABD) model. The whiskers in the box plot represent variability and individual data points represent outliers.