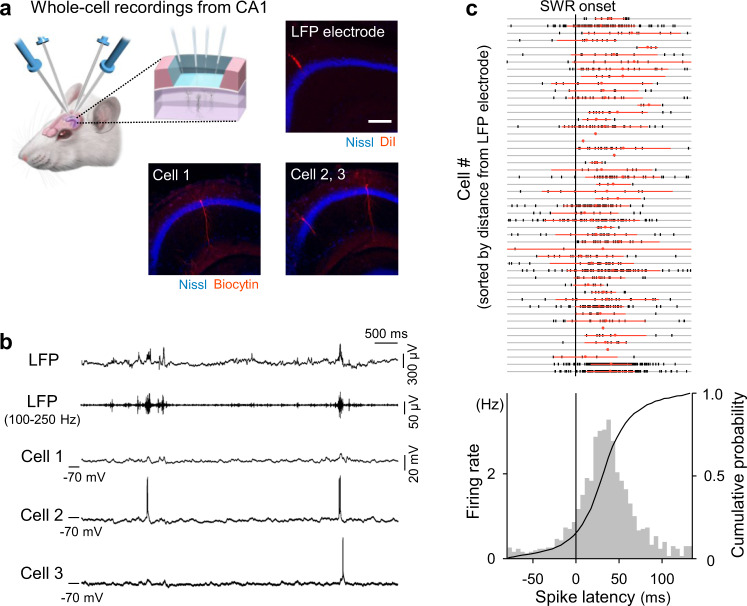
Fig. 1. Simultaneous patch-clamp recordings from multiple hippocampal CA1 pyramidal cells in vivo.
a Schematic depiction of in vivo patch-clamp recordings from up to four neurons in the mouse hippocampus. The right photographs show post hoc biocytin-based identification of the recorded triplets and the LFP electrode track. Scale bar = 200 µm. 10 triplets were recorded independently. b Representative traces of LFPs, 100–250 Hz bandpass-filtered LFPs, and simultaneously recorded subthreshold Vm values of three cells. c Top: All spike times in a total of 49 cells are shown in a raster plot, in which the cell order is sorted so that the distances from the LFP electrode tips are shorter in higher rows. The nine cases where we could not measure the distances are shown in the nine bottom rows. Each vertical tick mark indicates a single spike. Red dots and lines are the means ± SDs of spike times in the corresponding cells. Bottom: Distribution of all 1185 spike times in 49 cells relative to the SWR onsets. Source data is provided as a Source data file.

