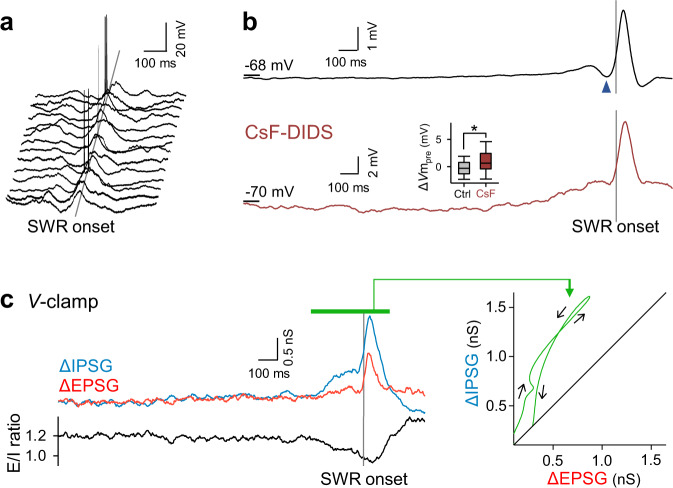
Fig. 2. Pre-SWR hyperpolarizations reflect inhibitory inputs.
a Fourteen representative Vm traces from 8 CA1 pyramidal cells, including noticeable pre-SWR hyperpolarizations, are aligned to the SWR onsets (gray straight line). b Top: A total of 5934 Vm traces in 64 cells were averaged relative to the SWR onsets. The dark blue arrowhead indicates pre-SWR hyperpolarization. Bottom: The same as the top, but for 341 Vm traces recorded in 31 CsF-DIDS-loaded cells. The pre-SWR hyperpolarization was reduced. The inset shows the quantification of ΔVmpre (P = 3.1 × 10⁻²⁹, t6317 = −11.3, Student’s t-test (two-sided), n = 5971 and 348 SWRs for control and CsF-DIDS conditions, respectively). Box plots indicate the median and 25–75% interquartile ranges; whiskers cover 10–90% quantiles. c Left: The top traces show SWR-aligned average of time changes in 34 EPSGs (red) and 57 IPSGs (blue) recorded from 5 cells. The bottom trace shows the ratio of the mean EPSGs to the mean IPSGs. Right: The temporal coevolution (black arrows) of EPSGs and IPSGs in the top left traces during SWRs (the period shown by the green bar) in the EPSG-vs.-IPSG space. IPSG increased earlier than EPSG. Source data is provided as a Source data file.

