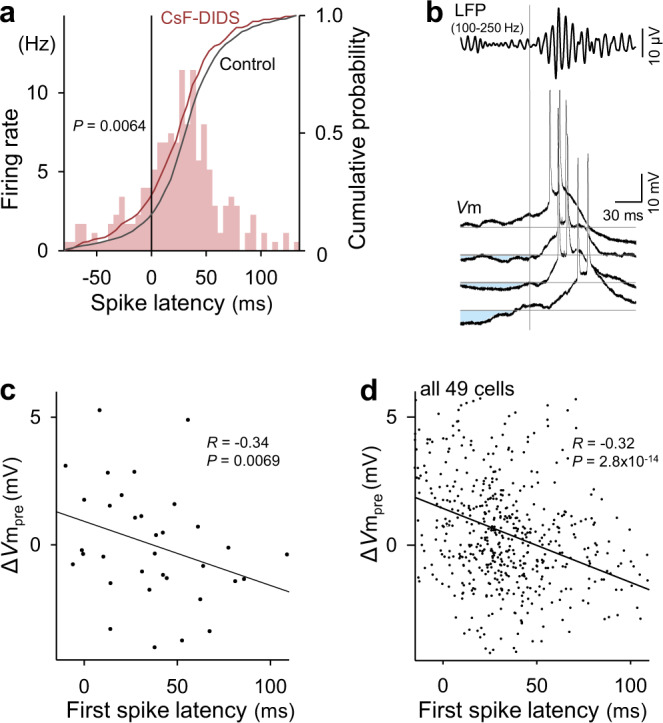
Fig. 3. Pre-SWR inhibition determines SWR-relevant spike times.

a Distribution of 230 spike times in 31 cells relative to the SWR onsets for recordings under blockade of Cl− conductances with intracellular CsF-DIDS (colored bars and cumulative curve). The gray line shows the cumulative probability for recordings without CsF-DIDS. Significance was determined using the Kolmogorov–Smirnov test. b Four representative Vm traces from a CA1 pyramidal cell, including action potentials during SWRs, are aligned to the SWR onsets (vertical gray line). The top trace shows the averaged bandpass-filtered LFPs. Larger prior hyperpolarizations (light blue areas) from the baseline (horizontal gray lines) are associated with later first spike times. c The relationship between ΔVmpre and the first spike times during SWRs. The line of best fit was determined using the least-squares method for a total of 35 spikes. Significance was determined using a t-test of the correlation coefficient (two-sided). d The same as (c), but for the pooled data of all 556 spikes from 49 cells. For visualization purposes, the range of the ordinate was limited, but all data points, including the outliers, were used for the linear regression. Source data is provided as a Source data file.
