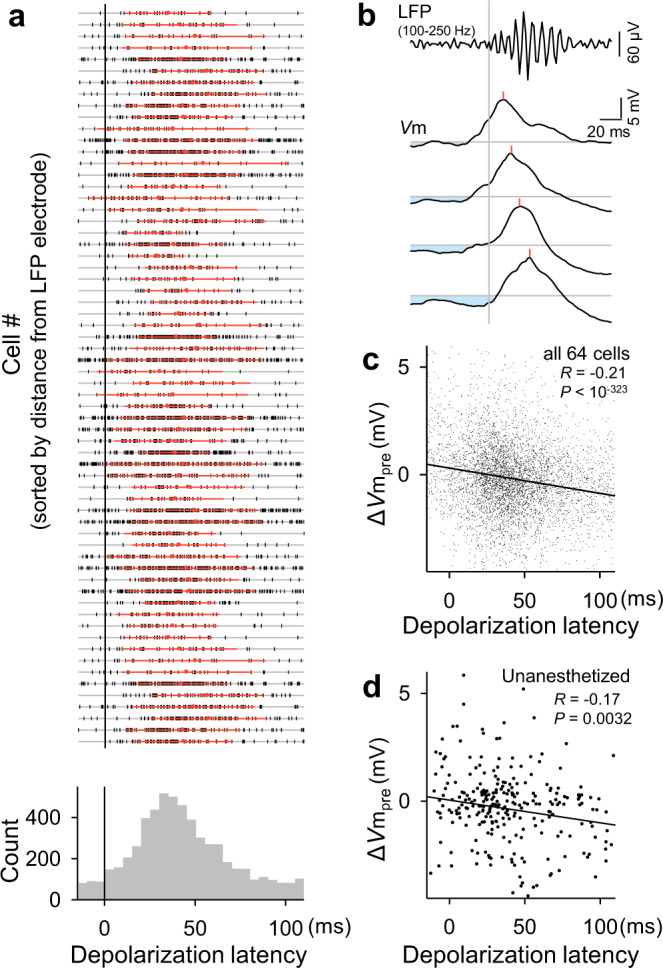
Fig. 4. Pre-SWR hyperpolarizations determine the times of SWR-relevant depolarizations.

a Top: All depolarization peak times in a total of 64 cells are shown in a raster plot, in which the cell order is sorted so that the distances from the LFP electrode tips are shorter in higher rows. The ten cases where we could not measure the distances are shown in the ten bottom rows. Each vertical tick mark indicates a single SWR event. Red dots and lines are the means ± SDs of depolarization peak times in the corresponding cells. Bottom: Distribution of the peak times of all 5682 depolarizations in 64 cells relative to the SWR onsets. b Four Vm traces sampled from a representative CA1 pyramidal cell were aligned with the SWR onsets (vertical gray line). The top trace is the mean of the bandpass-filtered LFPs. Light blue areas indicate preceding hyperpolarizations from the baseline (horizontal gray lines). Red lines indicate the depolarization peak times during SWRs. c The relationship between ΔVmpre and the depolarization peak times during SWRs. The line of best fit was determined using the least-squares method for a total of 5971 SWRs in all 64 cells. Significance was determined using a two-sided t-test of the correlation coefficient. For visualization purposes, the range of the ordinate was limited, but all data points, including the outsiders, were used for the linear regression. Larger preceding hyperpolarizations from the baseline are associated with later depolarization times. d The same as (c) but for 285 SWRs recorded from all 9 cells in unanesthetized head-fixed mice. Source data is provided as a Source data file.
