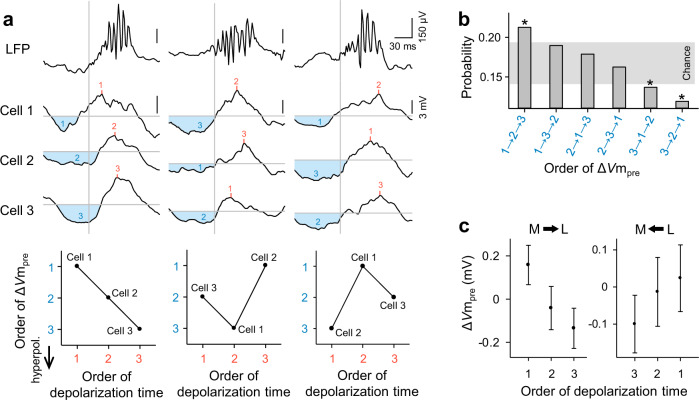
Fig. 5. Pre-SWR hyperpolarizations in hippocampal CA1 pyramidal cells are associated with SWR-relevant depolarization times among multiple pyramidal cells.
a Representative Vm traces sampled from three simultaneously recorded CA1 pyramidal cells (cells #1, #2, and #3) during three SWR events. The top traces are raw LFPs. Light blue areas indicate hyperpolarizations preceding SWRs, whereas red lines indicate the depolarization peak times during SWRs. Each bottom plot indicates the rank relationship between the orders of ΔVmpre and the depolarization peak times in 3 cells during the corresponding SWR. The orders correspond to the numbers shown in the traces (blue: ΔVmpre, red: depolarization peak time). b Distribution of the orders of ΔVmpre under the conditions that the depolarization peak times across three cells were sorted as 1 → 2 → 3. *P < 0.05 (two-sided) was determined using a random sampling method with 10,000 simulated trials in which the ΔVmpre values were randomly exchanged across cells within each SWR. The gray zone indicates the 95% confidence interval estimated from the simulated trials. c Among three simultaneously recorded cells, cells that showed larger ΔVmpres depolarized later, whereas the same cells depolarized earlier when they showed smaller ΔVmpres. The orders of cells were sorted depending on the cell locations, from the medial to lateral direction (left, herein “forward”) and from the lateral to medial direction (right, herein “backward”). Data are shown as the mean ± SEM of 333 and 335 triplets for the forward and backward directions, respectively. Source data is provided as a Source data file.

