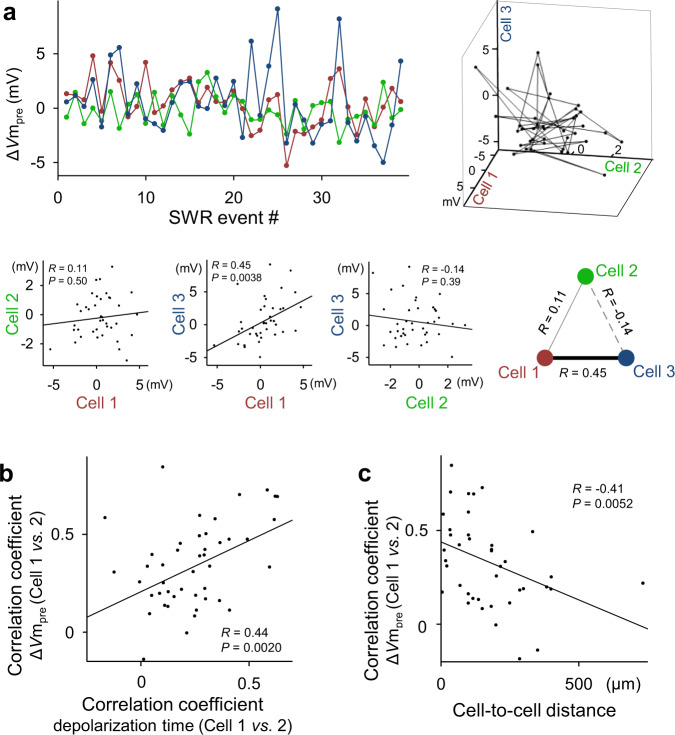
Fig. 6. Pre-SWR hyperpolarizations are spatiotemporally dynamic.
a Top: Representative plot of ΔVmpre for three simultaneously recorded cells along a time series of SWR events (left) and its three-dimensional visualization (right). Each dot in the graph indicates ΔVmpre for a single SWR event. Bottom: Correlations of ΔVmpre between all three possible pairs of cells #1, #2, and #3. All the remaining data are shown in Supplementary Fig. 9. b The correlation coefficients of ΔVmpre are plotted against those of the depolarization peak times for all 46 cell pairs. c The correlation coefficients of ΔVmpre are plotted against the distances between the cell pairs. In all correlation graphs, the lines of best fit were determined using the least-squares method and statistically evaluated using a t-test of the correlation coefficient (two-sided). Source data is provided as a Source data file.

