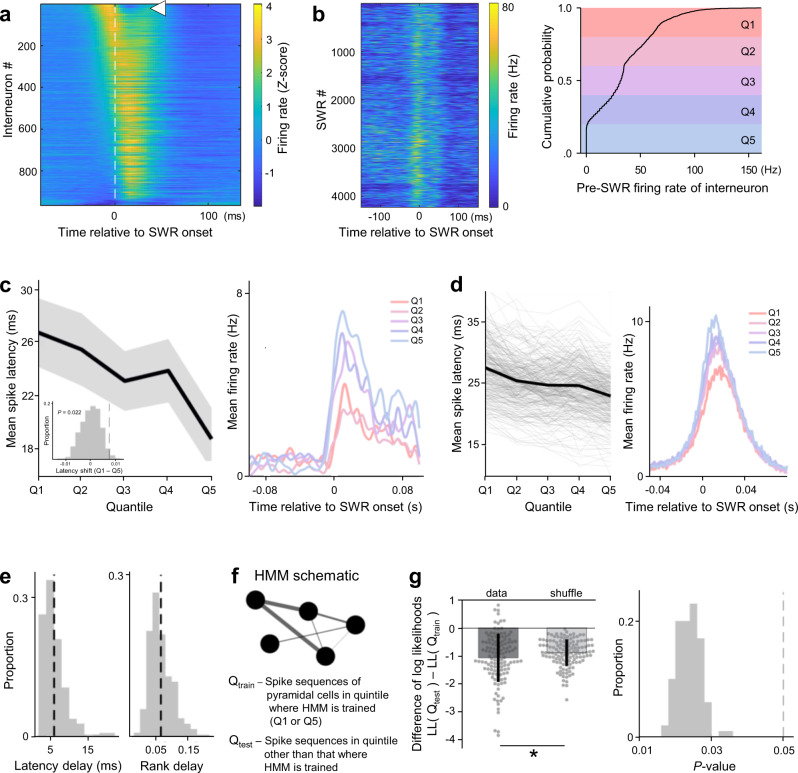
Fig. 7. Pre-SWR interneuron firing predicts spike times of pyramidal cells during SWRs.
a Average interneuron firing rates (Z-score) around SWR onsets, ordered by average rate 30 ms prior to SWR onset. The white arrowhead highlights the interneuron shown in (b). b Left: Consistent rate increases before SWRs despite heterogeneous firing rate magnitudes in an example interneuron. Right: Spike trains were smoothed (15 ms FWHM Gaussian), and the cumulative distribution of pre-SWR firing rates (computed in 30-ms windows before SWR onset) was divided into quintiles (Q1–Q5). c Left: Mean spike latencies (±SEM) in an example pyramidal cell as a function of quintiles Q1–Q5. Inset: To assess statistical significance, the difference in mean spike latency across Q1 and Q5 (7.6 ms for this example) was compared against a null distribution of spike latency differences obtained by shuffling SWRs across quintiles (n = 500). Right: Average firing rates across quintiles Q1–Q5 reveal that spike latency delay was associated with a decrease in firing rate. d Same as (c) but for n = 297 pyramidal cells whose spike latencies were significantly delayed. e Histograms of average latency (left) and rank (right) changes of all pyramidal cells that delayed their firing depending on the quintiles. Average latency delay of ~6 ms was associated with a rank-order change of ~6.6%. f Schematic of an HMM for quantifying sequential firing within SWRs. Circles denote patterns of pyramidal cell co-firing and edges of different widths represent transition probabilities between patterns. HMMs were fitted to pyramidal firing in all SWRs associated with a particular quintile (e.g., Q1; Qtrain), and the likelihood of pyramidal firing in SWRs of the other quintile (e.g., Q5; Qtest) was assessed under this model. g Left: The difference in log-likelihoods between the test and training quintiles quantifies the HMM goodness-of-fit to sequential firing in SWRs in the held-out test quintile. Significance was assessed against a null distribution in which SWRs were shuffled across quintiles (n = 128 quintile differences; P = 0.018, one-sided). The data are presented as means ± SDs. Right: n = 100 independent shuffles were performed to control for spurious resampling effects. The resulting P-values are shown as a histogram.

