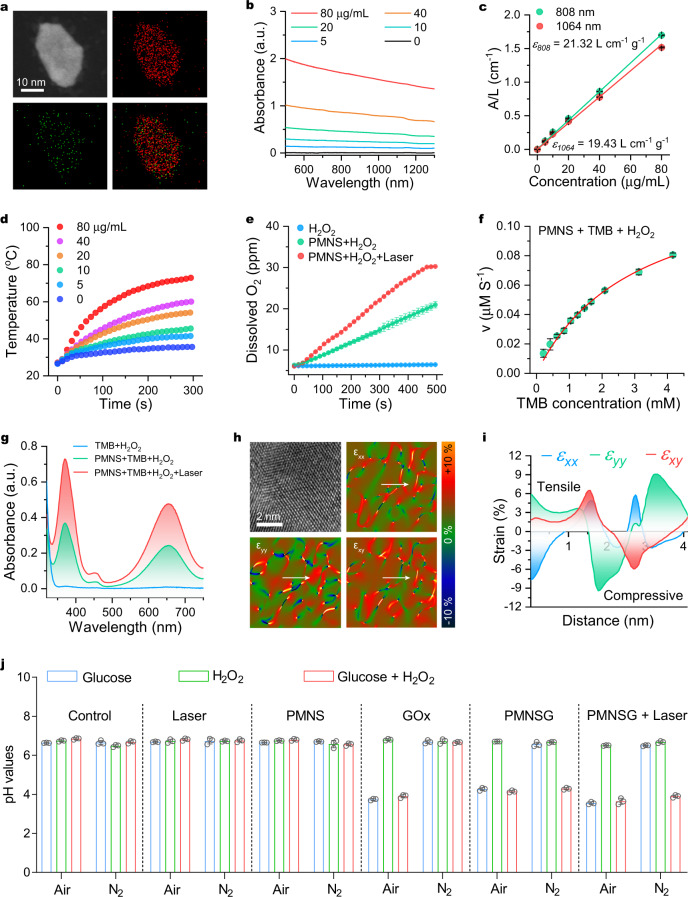
Fig. 2. Characterization of PMNS and PMNSG.
a EDS elemental mapping of Pd and Mo in a single bimetallene nanosheet. b UV-Vis-NIR spectra of PMNS at different concentrations. c The relationships between the ratio of the absorbance of PMNS at 808 and 1064 nm to the length of cuvette (L) (A/L) on the PMNS concentration (C). Data are presented as mean ± SD. (n = 3). d Concentration-dependent photothermal curves of PMNS (0, 5, 10, 20, 40, 80 μg/mL) under 1064-nm laser irradiation for 5 min. e O2 generation in different treatments (H2O2, H2O2 + PMNS and H2O2 + PMNS + laser). Data are presented as mean ± SD. (n = 3). f Kinetics for POD-like activity of PMNS. Data are presented as mean ± SD. (n = 3). g UV-Vis absorption spectra of TMB in acid buffer solution (pH = 5.4) with and without 1064-nm laser irradiation (0.4 W cm−2). h Surface strain mapping for PMNS along with different directions (εxx, εyy and εxy), and i the corresponding strain distribution along the white arrows. j Variation of pH values after various treatment. Data are presented as mean ± SD. (n = 3). Source data are provided as a Source Data file.

