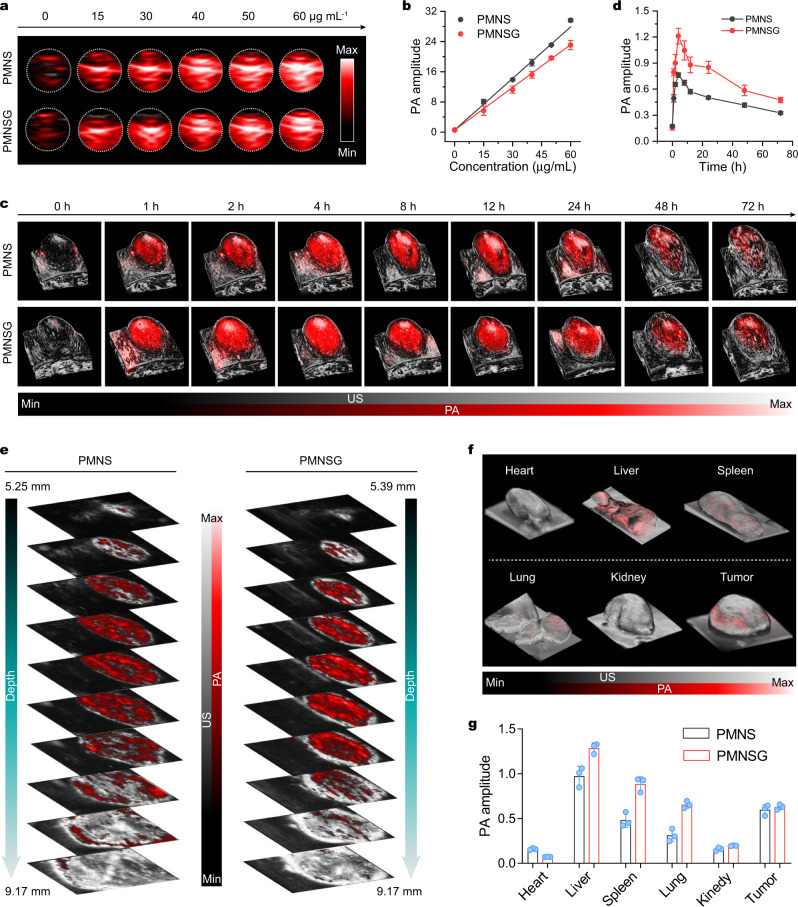
Fig. 4. In vitro/vivo and ex vivo NIR-II PA imaging of PMNSG.
a, b In vitro NIR-II PA images of PMNS and PMNSG at different concentrations and the corresponding liner fits of NIR-II PA amplitude as a function of concentration at 1280 nm, respectively. c, d Time-dependent 3D-rendered NIR-II PA/US images of tumor sites after i.v. injection of PMNS and PMNSG and the corresponding quantification of PA amplitude as a function of time, respectively. Data are presented as mean ± SD. (n = 3). e Tomography images-depth resolved B-scan PA/US images of tumor regions after intravenous administration of PMNS and PMNSG. f Ex vivo 3D-rendered PA/US images of various organs. g Quantification of NIR-II PA amplitude in (f) (Data are presented as mean ± SD. n = 3). Source data are provided as a Source Data file.

