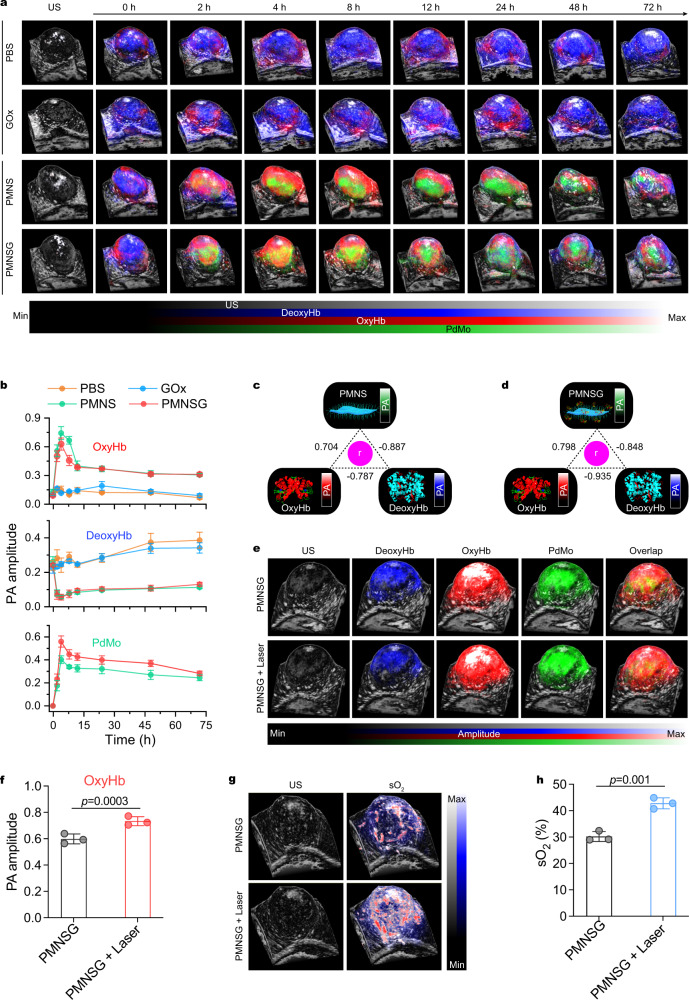
Fig. 5. In vivo simultaneous PA imaging monitoring of OxyHb, DeoxyHb and PMNSG in real-time.
a, b Time-course of 3D-rendered B-mode PA/US images of OxyHb, DeoxyHb and PdMo in tumor region after i.v. injection of PBS, GOx, PMNS and PMNSG (a) and the corresponding quantification of PA values as a function of time, respectively (b). Data are presented as mean ± SD. (n = 3). c, d Correlation analysis among DeoxyHb, OxyHb and PMNS (c) or PMNSG (d) signal intensities shown in b. e 3D-rendered B-mode PA/US images of mice after PMNSG treatment for 4 h and then 1064-nm laser irradiation for 10 min. f Quantification of PA values for oxyHb in e. Data are presented as mean ± SD. (n = 3). Statistical significance was calculated via one-tailed Student’s t test. g 3D-rendered B-mode PA/US images of sO2 after PMNSG treatment for 4 h and then 1064-nm laser irradiation for 10 min. h Quantification of PA values for sO2 values in (g). Data are presented as mean ± SD. (n = 3). Statistical significance was calculated via one-tailed Student’s t test. Source data are provided as a Source Data file.

