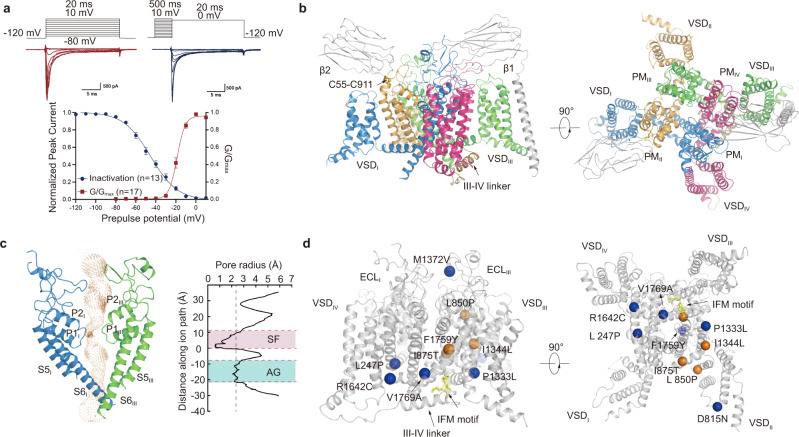
Fig. 1. Functional characterization and overall structure of human NaV1.3/β1/β2.
a Electrophysiological characterization of NaV1.3. A family of sodium currents conducted by NaV1.3 (Upper panel), a schematic diagram of the recording protocol is presented on top of each current traces respectively. Normalized conductance-voltage (G/V) relationship (Red squares) and steady-state fast inactivation (Blue circles) of NaV1.3 (Lower panel). For measuring G/V curve, NaV1.3/β1/β2 transfected HEK293T cells were measured with 20-ms depolarizing pulses between −80 mV and 10 mV in steps of 10 mV from a holding potential of −120 mV. For measuring steady-state fast inactivation, NaV1.3/β1/β2 transfected HEK293T cells were applied pre-pulse potentials between −120 mV and 10 mV in 10 mV increments for 500-ms followed by a 20-ms test pulse at 0 mV. The Boltzmann distribution has been fitted to each data set, yielding voltage-dependent activation V1/2 = −18.8 ± 0.4 mV (n = 17) and steady-state fast inactivation V1/2 = −45.4 ± 1.2 mV (n = 13). b Overall structure of human NaV1.3/β1/β2. The β1 and β2 subunits are colored in gray. The α subunit is colored in blue (DI), orange (DII), green (DIII), and magenta (DIV). c Ion conductance path of NaV1.3 calculated by HOLE. Plot of pore radii for NaV1.3 is shown in the right panel, ligand in the cavity was omitted when calculating pore radius. Two constriction sites are highlighted for selectivity filter (SF) in pink and intracellular activation gate (AG) in light blue. d Selected disease-related mutations are mapped on NaV1.3. Blue and orange spheres represent mutations related to focal-epilepsy and polymicrogyria, respectively. Source data are provided as a Source Data file.

