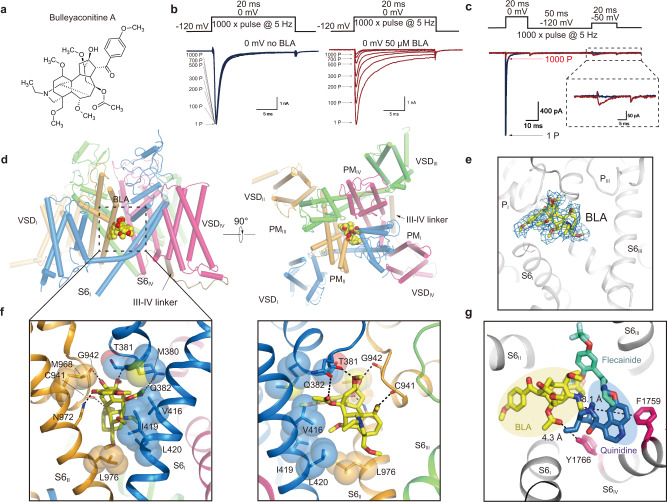
Fig. 2. The binding site of BLA in NaV1.3.
a The chemical structure of BLA. b BLA reduces peak current of NaV1.3 in a use-dependent manner. NaV1.3 transfected HEK293T cells were measured using a recording protocol of 1000 repetitive test pulses at 0 mV from holding potential (HP) at −120 mV at 5-Hz frequency without BLA (left panel), the traces showed robust and stable sodium influx after 1000 pulses. Transfected cells in bath solution containing 50 μM BLA were measured using the same recording protocol and the current traces showed progressive inhibition of NaV1.3 (right panel). Similar data were acquired from 6 cells in the absence or presence of BLA. c BLA elicits weak activation of NaV1.3 after binding. Two-pulse protocol, which is composed of a first 20-ms test pulse at 0 mV, backing to −120 mV for 50-ms followed by a second 20-ms test pulse at −50 mV, was used to elicit the activation of NaV1.3 by 50 μM BLA for 1000 repetitive pulses at 5-Hz frequency. The current trace of the first pulse (1 P) and the 1000 pulse (1000 P) are colored in black and purple, respectively. Similar data were acquired from 6 cells. d BLA binding site in NaV1.3. The complex structure is shown in side view (left panel) and top-down (right panel) view with BLA depicted in sphere models. The black dashed square indicates the area to be shown in panel (f). e The density at 3σ is shown in blue mesh for BLA, which is depicted in sticks. f Detailed binding site for BLA showing interactions between BLA and NaV1.3. The side chains of key residues are shown in sticks. Black dashed lines represent hydrogen bonds. g Comparison of the BLA binding site in NaV1.3 with the flecainide and quinidine binding sites in NaV1.5. Black dashed lines indicate the closest distances from BLA to F1759 and Y1766.

