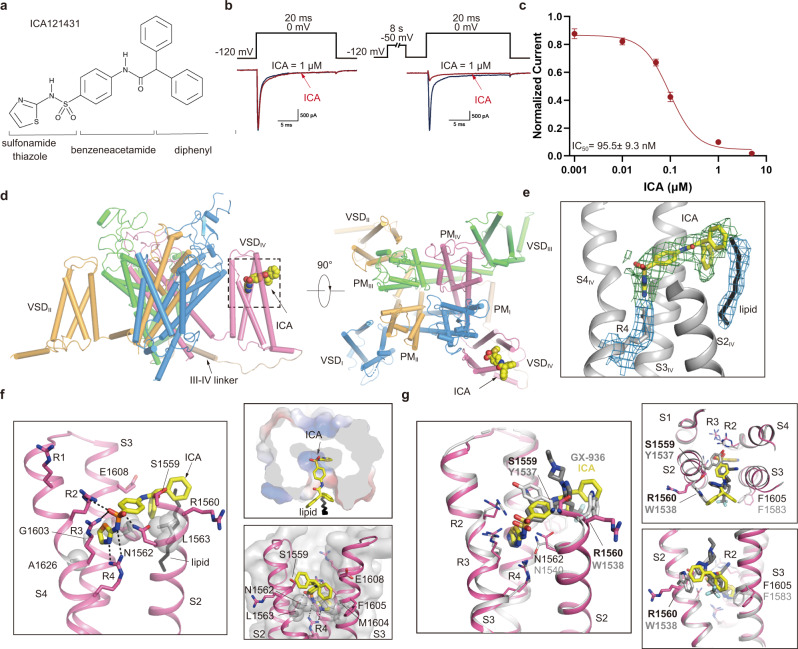
Fig. 4. Inhibition of NaV1.3 by ICA and the binding site for ICA.
a The chemical structure of ICA. b ICA preferentially inhibits NaV1.3 at inactivated state. Current traces were recorded on NaV1.3-transfected HEK293T cells, showing the effect of 1 μM ICA (red line) on NaV1.3 using a resting-state inhibition protocol containing a 20-ms voltage step to 0 mV from holding potential (HP) at −120 mV (left panel), or an inactivated-state inhibition protocol composed of an 8-sec pre-pulse conditioning step at −50 mV to inactivate roughly half channels and back to −120 mV for 10-ms followed by a 20-ms test pulse at 0 mV from HP at −120 mV (right panel). Similar data were acquired from 6 cells for each protocol. c Dose-response of ICA on human NaV1.3 using the inactivated-state inhibition protocol as described in panel (b). The Boltzmann distribution was fitted to each data of the normalized remaining peak current under different ICA concentrations, to yield IC50 at 95.5 ± 9.3 nM. Data are mean + /− SEM acquired from 3–6 cells. d ICA binding site in NaV1.3. The complex structure of NaV1.3 is shown in side view (left panel) and top-down view (right panel), with ICA shown in a sphere model. The black dashed square indicates the area to be shown in panel (f). e Cryo-EM densities at 2.4σ for ICA (green mesh), R4 and a potential lipid molecule (blue mesh). f Detailed binding site for ICA inside the VSDIV of NaV1.3. Side chains of key residues interacting with ICA are shown in sticks. Black dashed lines indicate electrostatic interactions between ICA and VSDIV. g Comparison of binding sites for ICA in NaV1.3 and GX-936 in NaV1.7 (gray). Key residues determining isoform selectivity are labeled in black for NaV1.3 and light gray for NaV1.7, respectively. Source data are provided as a Source Data file.

