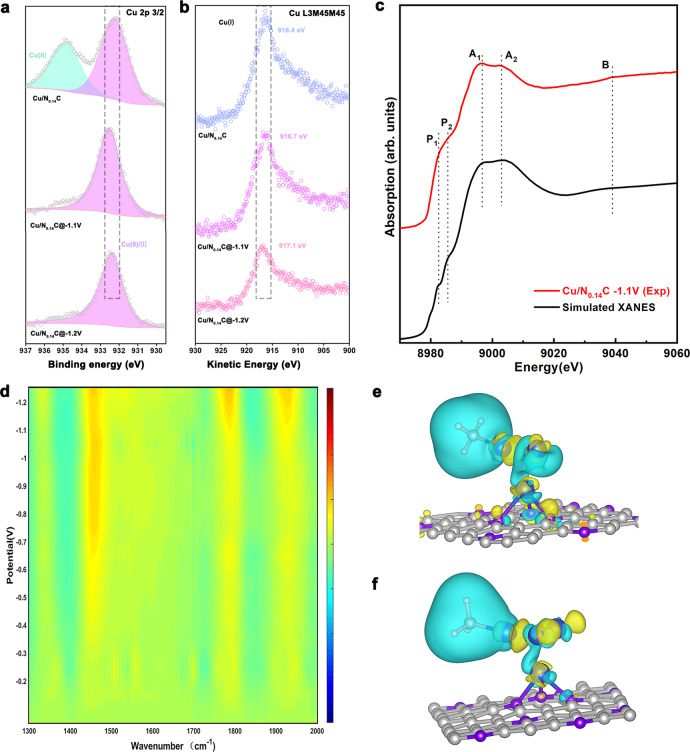
Fig. 4. Complementary Operando spectra characterizations, XANES simulation and DFT calculations.
a Quasi-in-situ XPS of the Cu 2p 3/2 for Cu/N0.14C. b Quasi-in-situ AES of the Cu L3M45M45 for Cu/N0.14C. c Comparison between the Cu K-edge XANES experimental spectra (red line) and the theoretical spectra (black line) calculated with the Cu2-CuN3 cluster. d Operando SR-FTIR of Cu/N0.14C. Electron density difference plot of the e Cu2–CuN3 cluster, f Cu3–CuN3 cluster. Blue and yellow represented the electron accumulation and deletion, respectively. The balls in gray, purple, blue and white represented C, N, Cu, and H atoms, respectively. All potentials were normalized to RHE.

