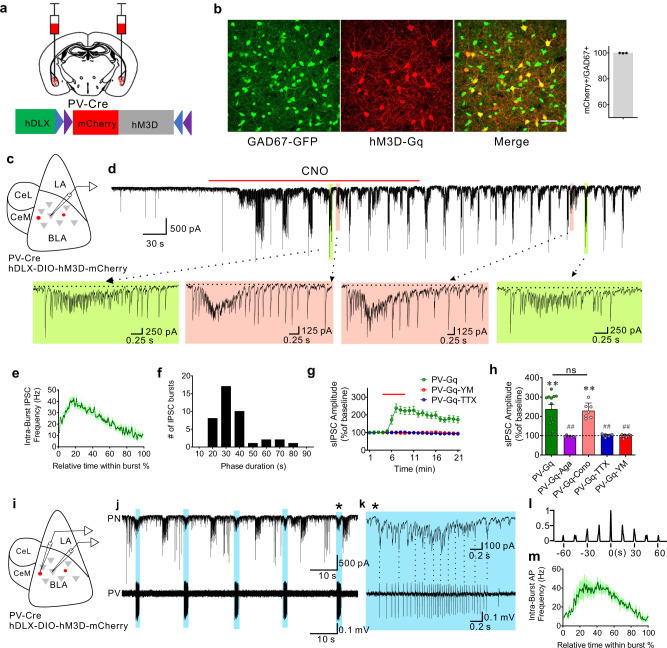
Fig. 1. Gq activation in PV interneurons stimulates patterned IPSC bursts in principal neurons.
a Schematic of injection of conditional AAV expressing Gq-coupled DREADD (hM3D) in BLA of PV-Cre mouse. b hM3D-mCherry transduced in PV neurons is localized to GABA neurons of Gad67-GFP knockin mice (ten sections, 278 cells from 3 mice, ratio = 99.81%). Scale bar, 50 µm. c Schematic showing whole-cell recordings of BLA principal neurons in Gq-DREADD-injected PV-Cre mice. d A representative recording in a BLA principal neuron showing the generation of phasic IPSC bursts by selective Gq activation in PV interneurons with bath application of CNO. Dashed arrows designate expanded traces of individual bursts to illustrate different stereotyped IPSC bursts (color-coded) at two successive time points. The dashed lines in the expanded traces show the depressed baseline of the holding current due to the summation of high-frequency IPSCs in the bursts. e Mean (±SEM) of instantaneous intra-burst IPSC frequency over the course of the accelerating IPSC bursts (41 bursts from 12 cells, 5 mice). f Distribution of the phase duration of repetitive IPSC bursts; 10-s bins from time −5 s to +5 s. (41 bursts from 12 cells, 5 mice). g, h Time course and mean change (±SEM) in sIPSC amplitude with Gq activation in PV interneurons. The CNO-induced increase in sIPSC amplitude was completely blocked by pre-incubation of the slices with the P/Q-type calcium channel antagonist ω-agatoxin (Aga) and the sodium channel blocker TTX, and the selective Gαq/11 inhibitor YM-254890 (YM), but not by the N-type calcium channel antagonist ω-conotoxin (Cono) (PV-Gq, 12 cells from 5 mice; PV-Gq-Agatoxin, 7 cells from 3 mice; PV-Gq-Conotoxin, 7 cells from 3 mice; PV-Gq-TTX, 8 cells from 4 mice; PV-Gq-YM-254890, 9 cells from 4 mice; Paired t-tests (two-tailed): PV-Gq vs. baseline, p = 0.0001; PV-Gq-Conotoxin vs. baseline, p = 0.0001; One-Way ANOVA, F(4,38) = 22.72, p < 0.0001, Dunnett’s multiple comparisons test, PV-Gq vs. PV-Gq-Agatoxin, p < 0.0001, PV-Gq vs. PV-Gq-Conotoxin, p = 0.98, PV-Gq vs. PV-Gq-TTX, p < 0.0001, PV-Gq vs. PV-Gq-YM-254890, p < 0.0001; **p < 0.01 vs. baseline, ##p < 0.01 vs. PV-Gq, ns not significant). i Schematic showing simultaneous loose-seal recordings from Gq-DREADD expressing PV interneurons and whole-cell recordings from BLA principal cells. j, k Representative paired recordings showing repetitive IPSC bursts recorded in a BLA principal neuron with whole-cell recording and associated action potential bursts recorded in a PV interneuron with loose-seal recording. Correlated activities are labeled with blue shading and the burst marked with an asterisk was expanded to show the time-locked IPSCs and action potentials. Selected synchronous spikes and IPSCs are designated by vertical dotted lines. l Autocorrelation diagram showing the rhythmicity of action potential bursts in the PV neuron shown in j. m Mean instantaneous intra-burst frequency (±SEM) of action potentials in PV interneurons (9 cells from 5 mice). Source data are provided as a Source Data file.

