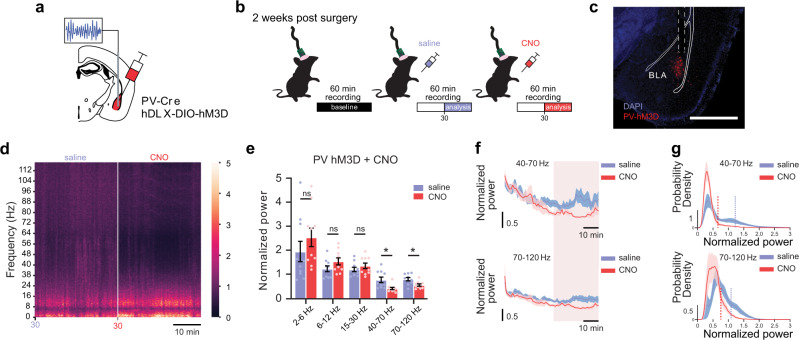
Fig. 6. Gq signaling in BLA PV interneurons reconfigures BLA oscillatory activity in vivo.
a Schematic illustrating hDLX-DIO-hM3D-mCherry injection and LFP recording strategy in the BLA of PV-Cre mice. b Experimental timeline for LFP recordings before (baseline) and after IP injection of saline, followed by CNO. c Representative image illustrating hM3D-mCherry expression and LFP recording electrode placement in the BLA (dashed lines). Scale bar, 1 mm. d Average spectrogram illustrating normalized power (0–5: low-to-high power) across frequencies over the last 30 min of saline and CNO treatments. e Mean (±SEM) normalized power across treatments (CNO vs. saline) and frequency bands. Values from last 30 min of recording were used for analysis, illustrated by the highlighted sections in f. Two-way ANOVA [treatment × frequency], F(1.081, 9.728) = 4.024, p = 0.0714; Sidak’s multiple comparisons test: 2–6 Hz, p = 0.6152; 6–12 Hz, p = 0.4240; 15–30 Hz, p = 0.6838; 40–70 Hz, p = 0.0228; 70–120 Hz, p = 0.0120. n = 10 mice. *p < 0.05, ns not significant. f Normalized power across time for 40–70 Hz (top) and 70–120 Hz (bottom). Values averaged in 1-min bins. Blue/red lines = average power over time, blue/red-shaded areas = SEM. Highlighted region indicates last 30 min included in analysis. g Average probability density plots illustrating the distribution of gamma powers across treatments for 40–70 Hz (top) and 70–120 Hz (bottom). Blue/red solid lines = average probability, blue/red-shaded areas = SEM. Vertical lines indicate average threshold value for distribution tails, where threshold = 1 standard deviation above the mean. Paired t-test (two-tailed), saline vs. CNO 40–70 Hz distribution tail powers (n = 10 mice, p = 0.0027); saline 2 vs. NE 70–120 Hz distribution tail powers (n = 10 mice, p = 0.0005). Source data are provided as a Source Data file.

