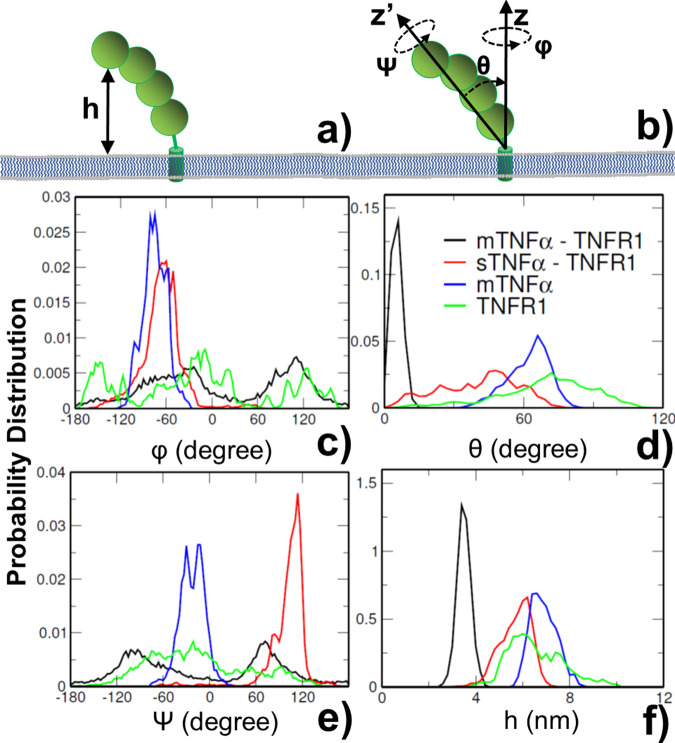
Fig. 3. The distributions of conformational parameters derived from molecular dynamic simulations.
These parameters include: the translational fluctuations of proteins along membrane normal, h, as shown in a, and three Euler angles which characterize the rotational phase space, as illustrated in b. The distributions of the angle around the long principal axis z′ of the protein ψ are shown in c as indexed by curves with different colors. the distributions of the tilting angle between this principal axis and the membrane normal θ are shown in d; and the distribution of the angle around the membrane normal z φ are shown in e. Similarly, detailed distributions of translational fluctuations are shown in f for proteins in four modeled systems.

