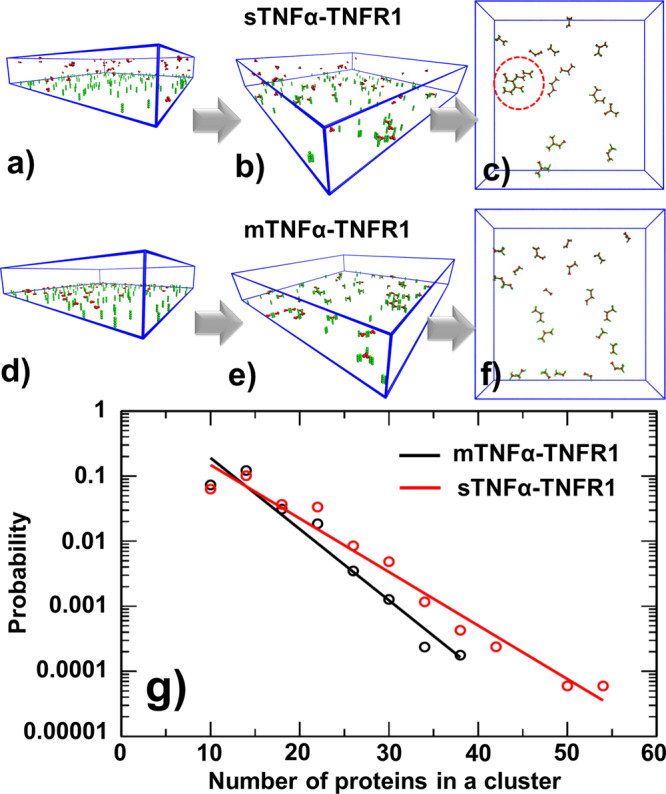
Fig. 6. The representative snapshots and cluster size distributions generated by domain-based diffusion-reaction simulations.

Some representative snapshots were selected from the simulations to visualize the spatial process of clustering. Specifically, the initial (a), middle (b) and final (c) configurations along a trajectory in sTNFα-TNFR1 system are compared with the initial (d), middle (e) and final (f) configurations along a trajectory in mTNFα-TNFR1 system. We found that large clusters can be organized into hexagonal lattice, as highlighted by the red dashed circle. Finally, we compared the cluster size distributions (g) in sTNFα-TNFR1 system (red) to the distribution in mTNFα-TNFR1 system (black). Given the logarithmic scale of the y-axis, the distributions of cluster size in both systems can be fitted by a single exponential function, whereas the clusters formed by sTNFα-TNFR1 complexes have the feasibility to grow into larger sizes.
