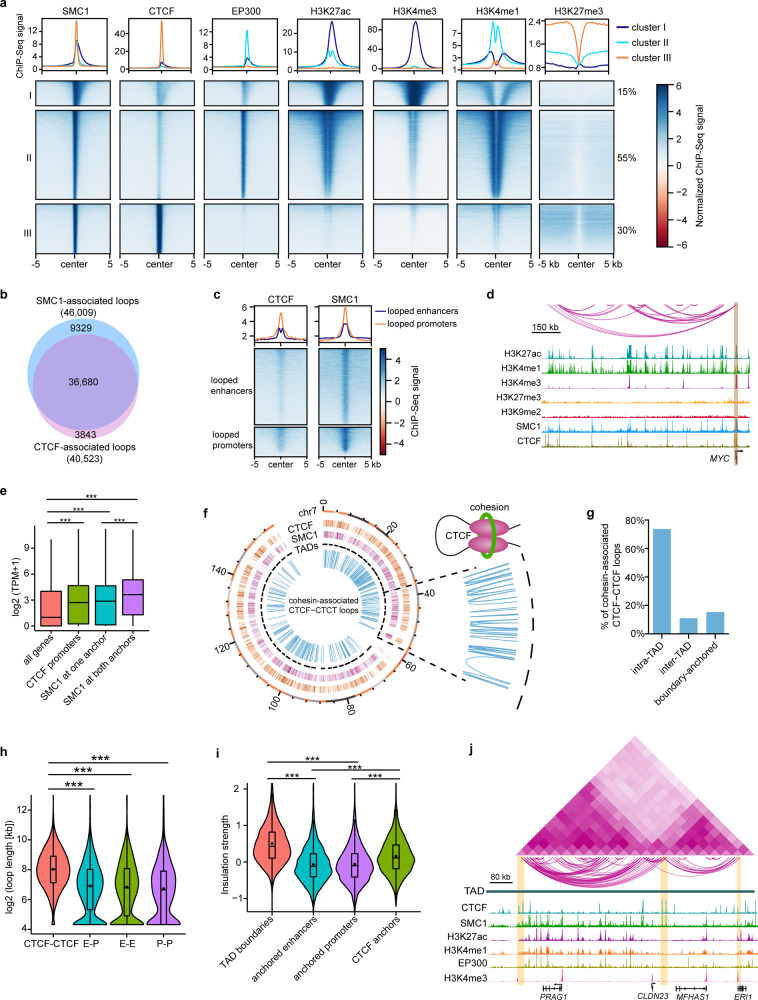
Fig. 4. CTCF and cohesin-associated chromatin looping.
a K-means clustering of the indicated ChIP-Seq enrichment at SMC1 sites. b Venn diagram showing the overlapping between SMC1- and CTCF-associated chromatin loops. c Metaplots and heatmaps showing the enrichment of CTCF and SMC1 at looped enhancers and looped promoters. d Identified chromatin loops and tracks for the indicated ChIP-Seq signals at MYC locus. e Boxplots showing expression levels of all genes (n = 25,045), interacting genes with SMC1 at one (n = 1265) or both anchors (n = 552) and genes with CTCF binding at promoters (n = 5877). ***p < 0.001 from two-way ANOVA. Boxplots indicate the 25th percentile (bottom of box), median (horizontal line inside box), and 75th percentile (top of box). f Circos plot showing the peaks of CTCF and SMC1, TADs, and cohesion-associated CTCF-CTCF loops on chromosome 4, with zoomed-in regions. g Percentages of cohesion-associated CTCF-CTCF loops that were intra-TAD, inter-TAD, and boundary-anchored. h Violin and boxplots showing the length of CTCF-CTCF (n = 6738), E–P (n = 6780), E–E (n = 7002) and P–P (n = 2689) loops. ***p < 0.001 from two-way ANOVA. i Violin and boxplots showing insulation strength of TAD boundaries (n = 3876), anchored enhancers (n = 4860), anchored promoters (n = 4791) and CTCF anchors (n = 8731). ***p < 0.001 from two-way ANOVA. j Chromatin interaction heatmap, identified loops, and tracks for the indicated ChIP-Seq signals within the indicated TAD. Boxplots (h, i) indicate the 25th percentile (bottom of box), median (horizontal line inside box), mean value (dark spot inside box), and 75th percentile (top of box). Whiskers indicate 1.5 times the interquartile range.

