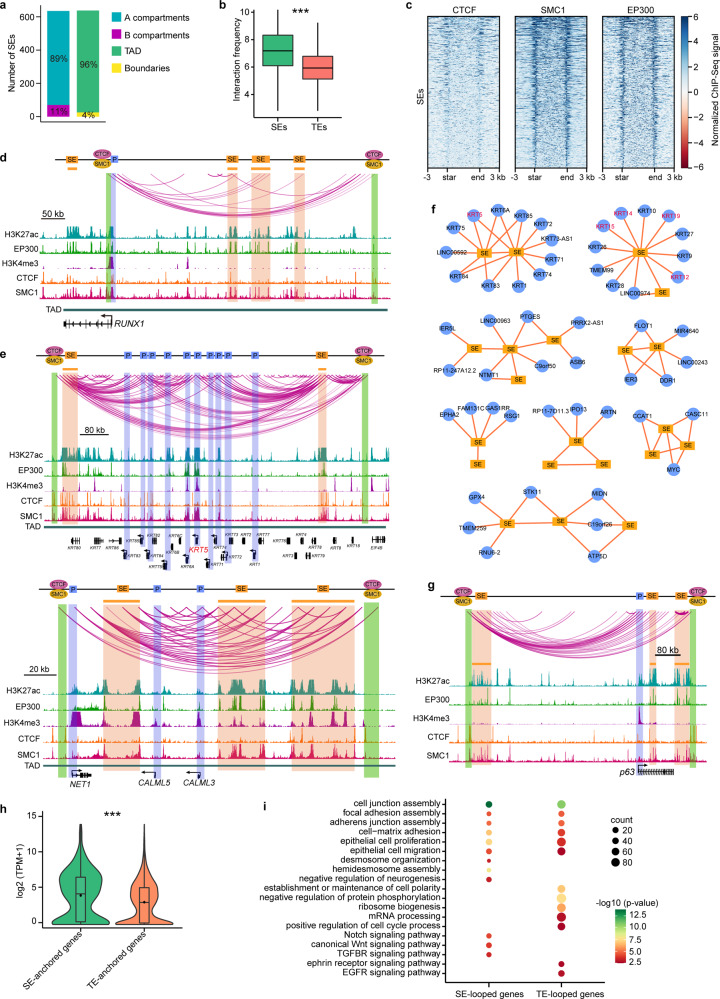
Fig. 7. SE-anchored chromatin interaction networks.
a Numbers of the SEs that are located at A and B compartments and located in TADs and TAD boundaries. b Boxplots showing the interaction frequencies of SEs (n = 535) and TEs (n = 8167). Boxes indicate the 25th percentile, median and 75th percentile. Whiskers indicate 1.5 times the interquartile range. ***p < 0.001 from two-way ANOVA. c Heatmaps showing the ChIP-Seq signals of CTCF, SMC1, and EP300 at SEs. d, e Identified chromatin loops and tracks for the indicated ChIP-Seq signals at the indicated loci. f Selected SE-anchored interaction hubs. Edges represent chromatin interactions. g Identified chromatin loops and tracks for the indicated ChIP-Seq signals around p63 locus. h Violin and boxplots showing the expression levels of SE-anchored (n = 589) and TE-anchored (n = 3855) genes. ***p < 0.001 from two-way ANOVA. Boxplots indicate the 25th percentile (bottom of box), median (horizontal line inside box), mean value (dark spot inside box), and 75th percentile (top of box). Whiskers indicate 1.5 times the interquartile range. i GO biological process analysis of SE-anchored and TE-anchored genes. P-values were calculated by hypergeometric distribution test.

