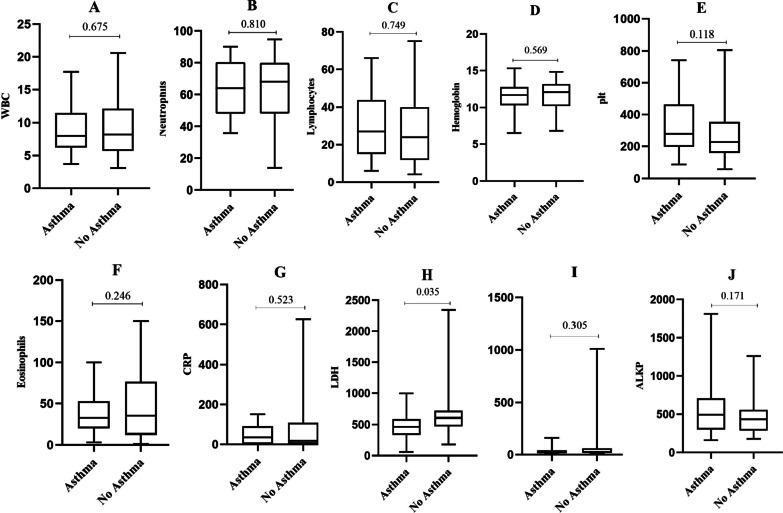
Fig. 3.
Laboratory results at COVID-19 diagnosis in hospitalized patients with asthma-like, in comparison with patients without asthma. The box is extended from percentiles 25th to 75th. The line in the box represents the median with ‘‘1’’ demonstrated as the mean. Whiskers are the minimum and maximum values. The nonparametric Mann–Whitney 2-tailed test was applied for statistical analysis. A: White Blood Cells (WBC); B: Neutrophils; C: Lymphocytes; D: Hemoglobin; E: Platet; F: Eosinophils; G: C-Reactive Protein (CRP); H: Lactate Dehydrogenase (LDH); I: Alanine transaminase (ALT); J: Alkaline phosphatase (ALKP)

