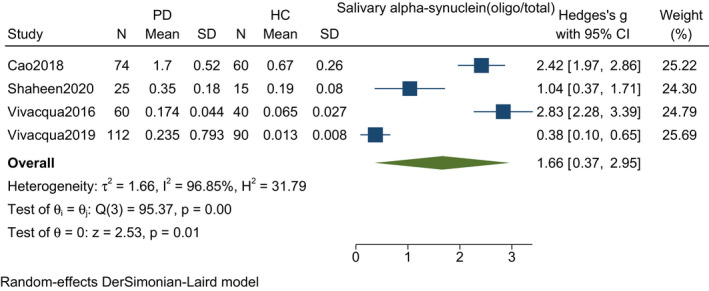
FIGURE 5.

Forest plot with 95% CI for meta‐analysis on the standardized mean difference of oligo to total salivary alpha‐synuclein among PD and controls. The square shows the mean difference for each study. The diamond at the bottom of the graph shows the average effect size of included studies
