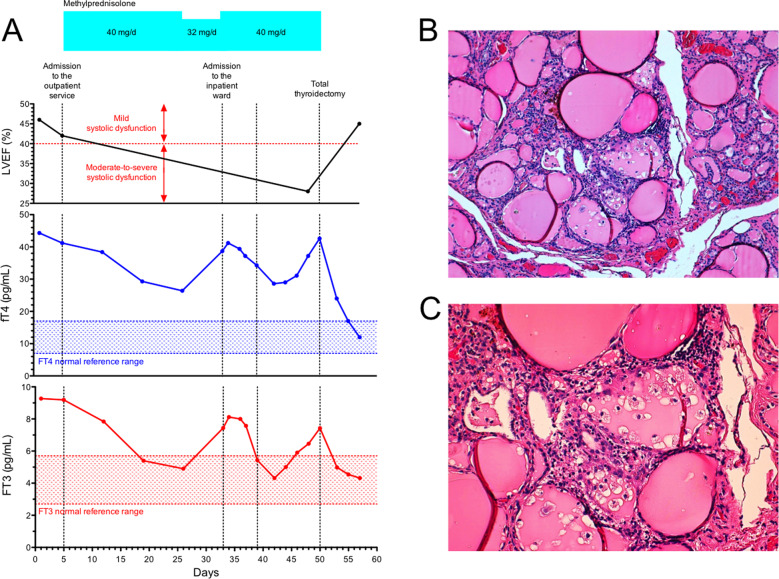
Fig. 1.
A Left ventricular ejection fraction and thyroid hormone concentrations over the course of the disease. Upper plot: LVEF, expressed as number %. Medium plot: FT4 concentrations, expressed in pg/mL. Lower plot FT3 concentrations, expressed in pg/mL. X axis reports the time (days); key moments in the patient’s clinical history are identified by vertical dotted lines. Y axis reports the appropriate variable for each panel, together with the respective reference ranges. Blue squares indicate methylprednisolone dosages. LVEF left ventricular ejection fraction; FT4 free thyroxine; FT3 free triiodothyronine. B, C Representative histopathological images from thyroid surgical specimens (hematoxylin and eosin staining). The focal disruption of the thyroid follicles is shown with small collections of macrophages intermingled with scattered lymphocytes (original magnification, ×10 and ×20, for B, C, respectively)

