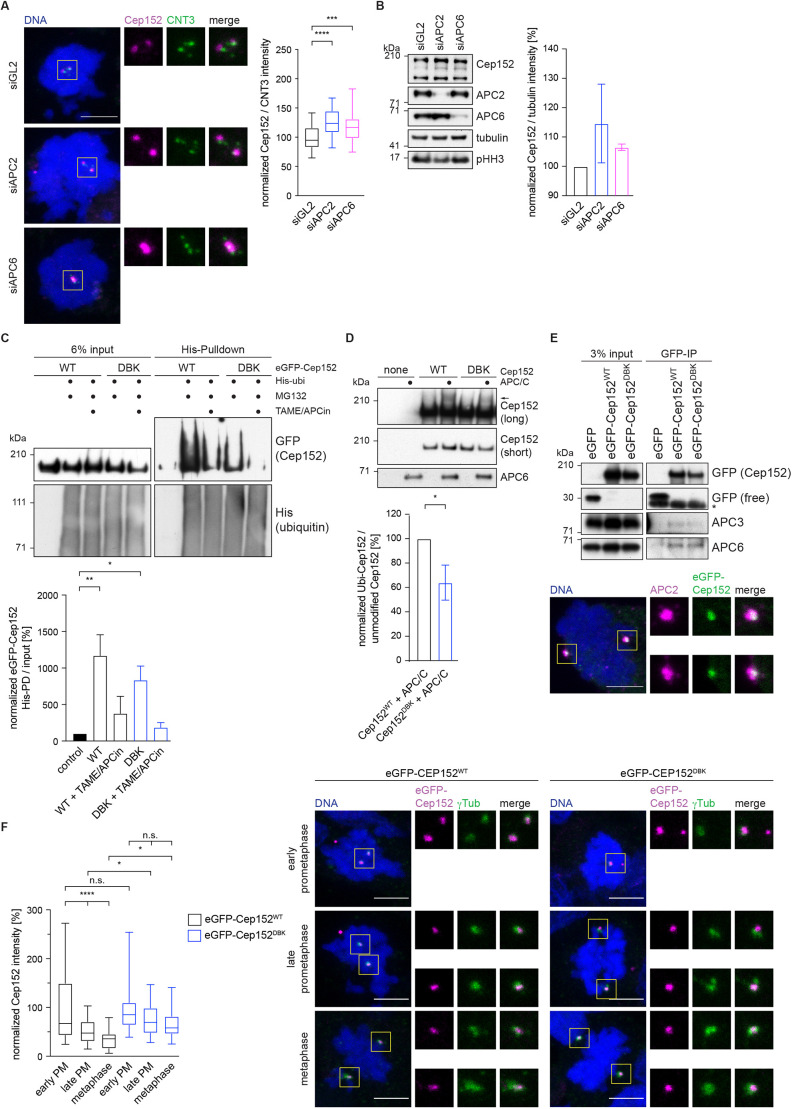
Fig. 3.
Cep152 is a substrate of the APC/C. (A) HEK293 cells were treated with siRNA against APC2, APC6 or GL2 (control) and arrested in mitosis with STLC according to the timeline shown in Fig. 2A. Cells were stained against the indicated proteins (CNT3, centrin-3) and DNA was labelled with DAPI. Boxes indicate regions shown in enlarged images. The fluorescence intensity of Cep152 at the centrosome was measured as indicated in Fig. 1B and normalized against the GL2 control (right). N cells=60 (siGL2), 60 (siAPC2), 62 (siAPC6). ***P=0.0002; ****P<0.0001 (simple one-way ANOVA with Dunnett's multiple comparison test). (B) HEK293 cells were treated as described in A, and whole-cell lysates were immunoblotted against the indicated proteins (left; pHH3, phosphorylated histone H3). The intensity of the Cep152 bands was measured and normalized to tubulin. The data from three experiments were normalized against their corresponding intensities from the siGL2 condition and plotted as mean±s.d. (right). (C) HEK293 cells expressing eGFP–Cep152WT (WT) or eGFP–Cep152DBK (DBK) were transfected with a plasmid expressing His–ubiquitin (His-ubi) and treated with the indicated reagents. His-tagged ubiquitin was pulled down from the cell lysate, and the eluate was blotted against the indicated proteins (top). The intensity values of the His-modified eGFP–Cep152 bands in the pulldown were normalized against the values from the corresponding input lanes (bottom) and plotted as mean±s.d. N immunoblots=2. *P=0.03; **P=0.007 (simple one-way ANOVA with Dunnett's multiple comparison test). (D) eGFP–Cep152 was immunoprecipitated from HEK293 cells expressing the indicated constructs. The eluate was used for in vitro ubiquitylation assays by incubation with purified APC/C. Arrow marks the ubiquitylated band (top). Short exposure was 30 s, long exposure was >5 min. The intensity of the ubiquitylated bands was measured, normalized to the corresponding unmodified band and plotted as mean±s.d. (bottom). N immunoblots=3. *P<0.05 (two-tailed paired Student's t-test). (E) Top: eGFP-tagged Cep152 proteins were immunoprecipitated from HEK293 cells expressing the indicated proteins. The co-eluted proteins were probed by immunoblotting. Asterisk marks unspecific bands. Blots are representative of two experiments. Bottom: Mitotic HEK293 cells expressing eGFP–Cep152WT were stained against the indicated proteins, and DNA was labelled with DAPI. Boxes indicate regions shown in enlarged images. Images are representative of two experiments. (F) HEK293 FlpIn T-Rex cell lines expressing eGFP–Cep152WT or eGFP–Cep152DBK were treated as shown in Fig. 2A and stained against the indicated proteins (right). DNA was labelled with DAPI. Boxes indicate regions shown in enlarged images. The fluorescence intensity of eGFP–Cep152 at the centrosome was measured as indicated in Fig. 1B and normalized against the intensity of early prometaphase (PM) cells of the corresponding cell line (left). N cells=44 (WT, early PM), 34 (DBK, early PM), 41 (WT, late PM), 61 (DBK, late PM), 33 (WT, metaphase), 38 (DBK, metaphase). *P<0.05; ****P<0.0001; n.s., not significant (one-way ANOVA followed by Tukey's multiple comparison test). Box plots in A and F show the median (line), 25–75% range (box) and 5–95% range (whiskers). Scale bars: 5 µm.

