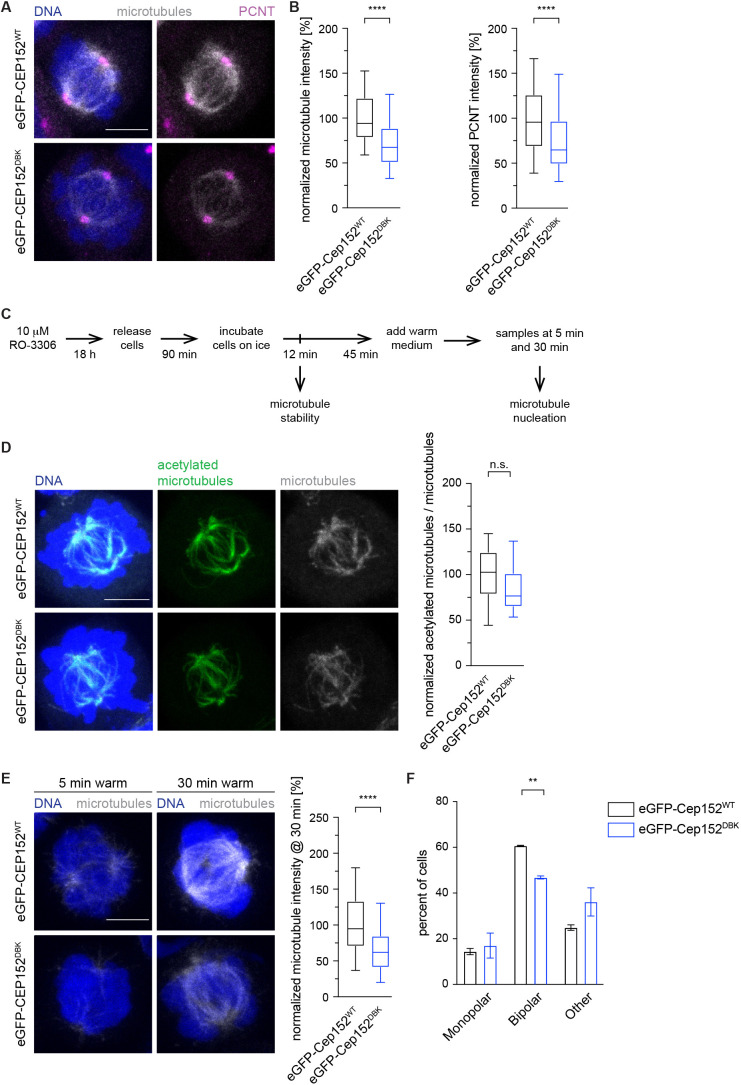
Fig. 4.
Cep152 is an inhibitor of mitotic spindle assembly and forms a complex with Cep57. (A) HEK293 FlpIn T-Rex cell lines expressing eGFP–Cep152WT (WT) or eGFP–Cep152DBK (DBK) were treated as shown in Fig. 2A and stained against the indicated proteins. Microtubules were labelled using an α-tubulin antibody and DNA was stained with DAPI. (B) The fluorescence intensity of tubulin in cells from A was measured in the whole cell and normalized against the eGFP–Cep152WT cell line (left). N cells=78 (WT), 77 (DBK). The fluorescence intensity of PCNT at the centrosome in cells from A was measured as indicated in Fig. 1B and normalized against the eGFP–Cep152WT cell line (right). N cells=158 (WT), 154 (DBK). ****P<0.0001 (simple one-way ANOVA with Dunnett's multiple comparison test). (C) Setup of experiments to understand microtubule stability and nucleation. Cells were collected at the indicated time points. (D) HEK293 FlpIn T-Rex cell lines expressing eGFP–Cep152WT or eGFP–Cep152DBK were treated according to the schedule in C and fixed to assess microtubule stability. Cells were stained to detect microtubules (anti-α-tubulin) and acetylated microtubules (antibody against acetylated Lys40 of α-tubulin), and DNA was labelled with DAPI (left). The fluorescence intensity of acetylated microtubules was measured in the whole cell and normalized to unmodified microtubules (right). N cells=19 (WT) and 23 (DBK). n.s., not significant (Mann–Whitney U-test). (E) HEK293 FlpIn T-Rex cell lines expressing eGFP–Cep152WT or eGFP–Cep152DBK were treated according to the schedule in C and fixed to assess microtubule nucleation. Cells were fixed and stained against tubulin and DNA was labelled with DAPI (left). The fluorescence intensity of tubulin was measured in the whole cell at 30 min after shifting cells back to 37°C and normalized against the eGFP–Cep152WT cell line (right). N cells=61 (WT), 66 (DBK). ****P<0.0001 (simple one-way ANOVA with Dunnett's multiple comparison test). (F) Cells from E were analysed for their spindle morphology. Data are the mean±s.d. percentages of cells with each spindle phenotype from three experiments. **P=0.0038 (two-tailed paired Student's t-test). Box plots in B,D,E show the median (line), 25–75% range (box) and 5–95% range (whiskers). Scale bars: 5 µm.

