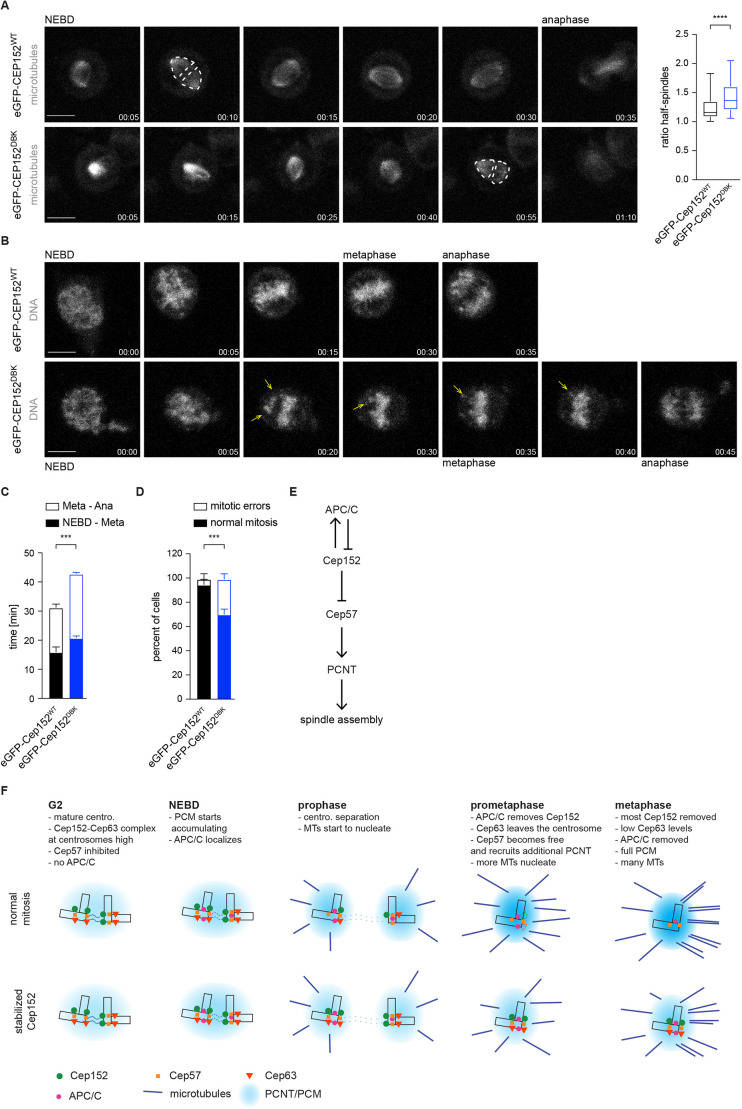
Fig. 6.
Persistent Cep152 at the centrosome leads to mitotic errors. (A) eGFP–Cep152WT (WT) and eGFP–Cep152DBK (DBK) HEK293 cell lines were subjected to live-cell imaging (time is shown as hh:mm). Exemplary still images from the movies are shown. See Movies 5 and 6. Nuclear envelope breakdown (NEBD) and anaphase onset are marked. Microtubules were stained with SiR-tubulin (left). Microtubule intensity was measured in two separate areas (indicated by the dotted lines), called half-spindles, and the brighter area was divided by the dimmer one (right). Every time point was measured in the same way. Box plot shows the median (line), 25–75% range (box) and 5–95% range (whiskers). N time points=46 (WT), 56 (DBK). *P=0.006 (Mann–Whitney U-test). (B) eGFP–Cep152WT and eGFP–Cep152DBK cell lines were subjected to live-cell imaging (time is shown as hh:mm). Exemplary still images from the movies are shown. See Movies 7 and 8. NEBD, metaphase and anaphase onset are marked. DNA was stained with SiR-DNA. Unaligned chromosomes are indicated by yellow arrows. (C) Cells from B were analysed for the time taken to progress from NEBD to metaphase (NEBD–Meta) and from metaphase to anaphase onset (Meta–Ana). Bar graphs show the mean±s.e.m.. N=4 experiments; WT=197 cells, DBK=189 cells. ***P=0.0006 (simple one-way ANOVA with Dunnett's multiple comparison test). (D) Cells from C were analysed for misaligned chromosomes during metaphase and lagging chromosomes during anaphase, combined as mitotic errors. Bar graphs show the mean±s.e.m. N=4 experiments. ***P=0.0005 (Holm–Sidak t-test). (E) Regulatory network of the APC/C and centrosomal proteins that regulate mitotic spindle assembly. The main APC/C-interacting protein at the centrosome is Cep152, which is also an APC/C substrate, creating a negative feedback loop. (F) Model of microtubule nucleation in the presence of wild-type (top) or stabilized (bottom) Cep152. Centro., centrosome; MTs, microtubules. Scale bars: 10 μm.

