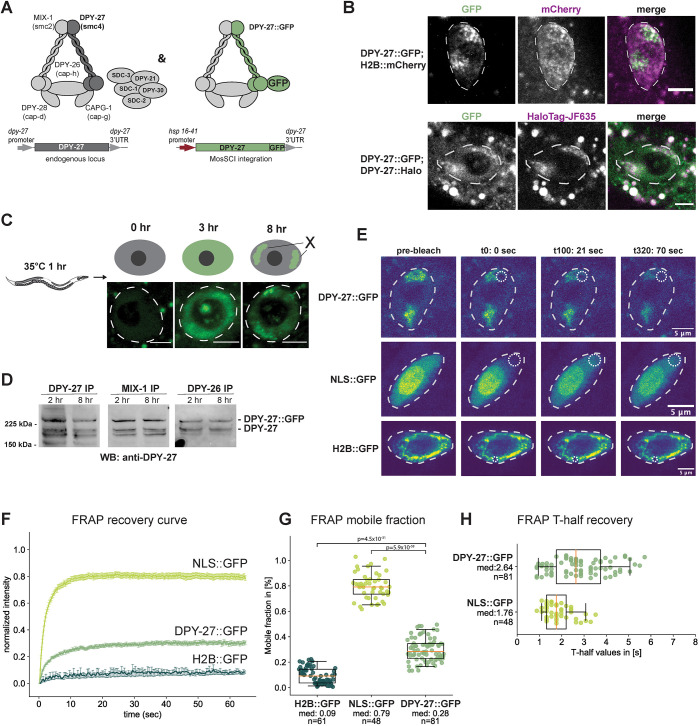
Fig. 1.
FRAP analysis of condensin DC binding. (A) Left panel illustrates condensin DC along with the rest of the DCC subunits. The right panel indicates the expression of GFP-tagged DPY-27 under the control of a heat shock-inducible promoter at the chromosome II MosSCI site. (B) DPY-27::GFP subnuclear localization to the X chromosomes in intestinal cells 8 h after heat-induced expression (top row) was validated by colocalization with the endogenously tagged DPY-27::Halo stained with JF635 HaloTag ligand (bottom row). Nuclei are outlined by white dashed lines. Images are representative of three biological replicates with a minimum of 20 images. Scale bars: 5 µm. (C) Illustration of the heat-shock protocol (top). Young adult worms were heat shocked for 1 h at 35°C, and fluorescence was followed in the large intestinal cells. DPY-27::GFP subnuclear localization indicative of X chromosome binding is apparent after 8 h of recovery. Representative example images from a total of three biological replicates with a minimum of 30 images are shown for each time point, with the nuclear area marked using a white dashed line. Scale bars: 5 µm. (D) DPY-27::GFP interaction with condensin DC subunits was validated by co-immunoprecipitation with MIX-1 and DPY-26. Young adult worms were used for immunoprecipitation (IP) either 2 h or 8 h after heat shock at 35°C for 1 h and analyzed by western blotting (WB) using an anti-DPY-27 antibody. The intensity of the GFP-tagged DPY-27 and endogenous protein bands in the DPY-27 IP lane indicates the relative abundance of each protein. The intensity of the GFP-tagged DPY-27 and the endogenous protein bands in the other lanes indicates the relative interaction of endogenous and DPY-27::GFP with the immunoprecipitated subunit. Blots are representative of three experiments. (E) FRAP sequence for intestine nuclei of adult C. elegans worms expressing either DPY-27::GFP, NLS::GFP or H2B::GFP. The first column of images depicts the first image of the pre-bleach series (a total of 20 images). The second column shows the first image after the single point bleach, with the bleached area indicated by the dotted circle. The third and fourth columns depict two time points after the bleach point: t100 (21 s) and t320 (70 s), respectively. Nuclei are outlined by white dashed lines. (F) Mean FRAP recovery curves from worms expressing wild-type DPY-27::GFP, H2B::GFP or NLS::GFP. Data are mean±s.e.m. Numbers of bleached single intestine nuclei (from at least three biological replicates) for each experiment are n=81 for DPY-27::GFP, n=48 for NLS::GFP and n=61 for H2B::GFP. (G) Mobile fractions for the different GFP-tagged proteins or free GFP. The mobile fraction is the lowest for H2B::GFP and the highest for NLS::GFP. The mobile fraction for DPY-27::GFP is ∼28%. P-values are from an two-tailed independent two-sample t-test. (H) FRAP half time recovery (T-half) values for the bleach curves shown in Fig. 1F. The half time recovery for NLS::GFP shows a shorter diffusion time than DPY-27::GFP. H2B::GFP is not shown due to the very low recovery of the fluorescence signal during the experimental time frame. Boxplots in G and H show the median (line), interquartile range (box) and whiskers at the 5th and 95th percentile of the dataset. The median values (med) and number of nuclei analyzed are shown for each group.

