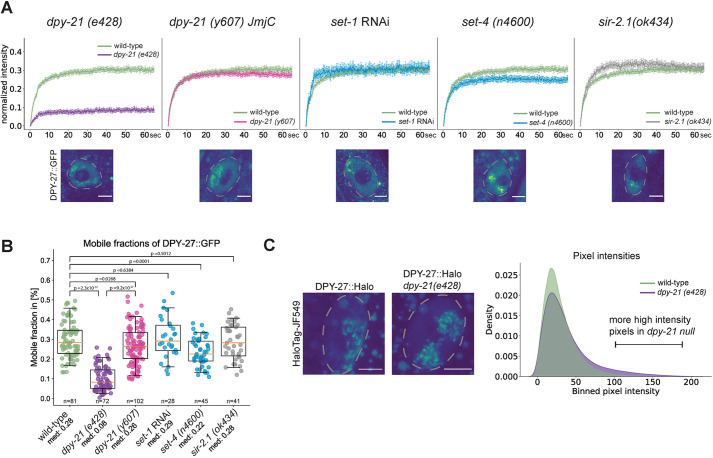
Fig. 4.
The dpy-21 null mutant but not the dpy-21(JmjC) catalytic mutant reduces the proportion of mobile condensin DC. (A) Mean FRAP recovery curves of DPY-27::GFP in either wild-type (green) or different mutant conditions. Data are mean±s.e.m. Numbers of bleached single intestine nuclei (from at least three biological replicates) for each experiment are n=81 for wild type, n=72 for the dpy-21 null mutant [dpy-21 (e428)], n=102 for the dpy-21(JmjC) mutant [dpy-21 (y607)], n=28 for set-1 RNAi, n=45 for the set-4 null mutant [set-4 (n4600)] and n=41 for the sir-2.1 null mutant [sir-2.1 (ok434)]. Corresponding images of intestine nuclei for each mutant condition are depicted under each FRAP curve. Nuclei are outlined by dashed lines. Scale bars: 5 µm. (B) Mobile fractions calculated from individual replicate FRAP recovery curves as shown in A. P-values are from a two-tailed independent two-sample t-test. Boxplots show the median (line), interquartile range (box). Whiskers are at the 5th and 95th percentile of the dataset. The number of images of nuclei analyzed is noted under each boxplot, along with the median values (med). (C) Analysis of endogenous DPY-27::Halo fluorescence intensity on the X chromosome in wild-type and dpy-21 null worms. The HaloTag signal of DPY-27 was segmented in 3D and quantified in adult intestine cells in two biological replicates (Fig. S4C). The left panel depicts two example nuclei (marked by dashed lines). Scale bars: 5 µm. For the wild-type worms, 27 images were analyzed, for the dpy-21(e428) mutant images of 35 nuclei were analyzed. The right panel shows the binned mean pixel fluorescence intensity for the two conditions in a smoothed density plot. The distributions of pixel intensities are significantly different in the two conditions, with a P-value of 1.46×10−114 (Mann–Whitney U-test).

