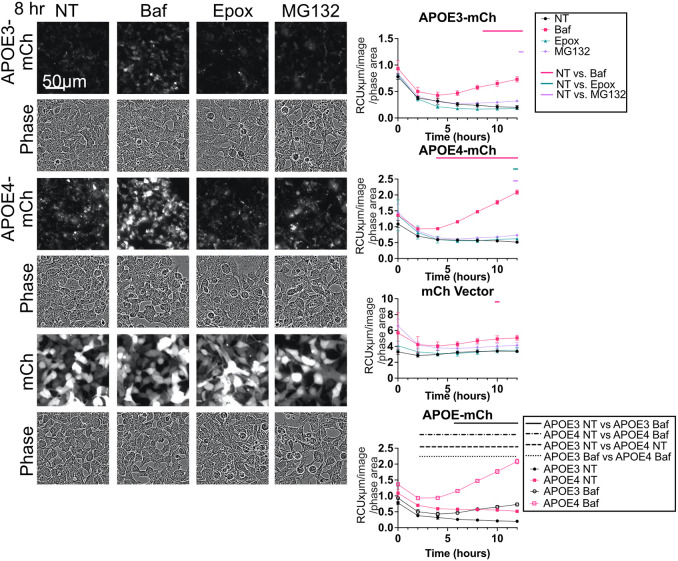
Fig. 2.
APOE is turned over by autophagy in HEK293 cells with stable APOE expression. Representative images and fluorescence intensity of APOE3–mCh, APOE4–mCh, or mCh cells treated with Baf (50 nM 4 h), Epox (100 nM), or MG132 (50 µM). Quantitative results are mean±s.e.m. Bars over graphs indicate time points at which P<0.05 on two-way ANOVA with post-hoc Dunnett test.

