Fig. 7.
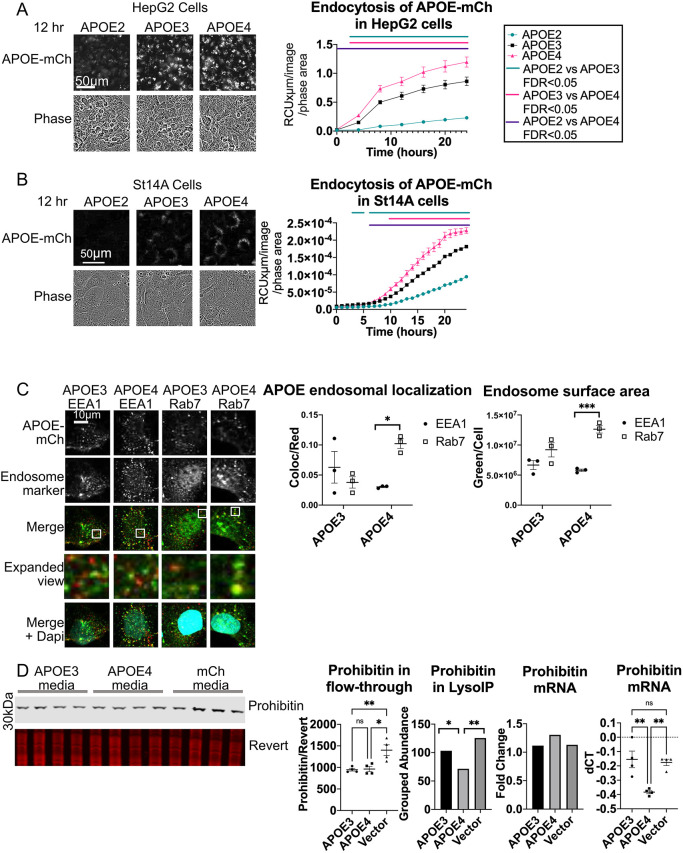
Fluorescently tagged APOE is endocytosed in an isoform-dependent manner and alters endosomal morphology. (A,B) APOE–mCh-conditioned medium was collected from HEK293T cells and applied to (A) HepG2 and (B) ST14A cells. Cells were imaged and red fluorescence/phase area calculated. Bars represent times when FDR<0.05 between APOE isoforms by two-way ANOVA. (C) ST14A cells were treated for 24 h with conditioned medium with APOE3–mCh or APOE4–mCh (red), and immunocytochemistry for EEA1 or Rab7 (green) was performed, and cells stained with DAPI (blue). Cells were imaged by confocal microscopy and analyzed using Imaris image. Magnified view indicates enlarged images from white boxes in merge panel. (D) HepG2 cells were treated for 24 h with APOE3–mCh or APOE4–mCh conditioned medium, lysosomes were immunoprecipitated and proteomic contents analyzed by mass spectrometry. Proteins reduced in APOE4 lysosomes that were not reduced in mCh-treated cells included mitochondrial proteins such as prohibitin. Western blot analysis for prohibitin was performed on lyso-depleted flow-through. Revert, protein stain. HepG2 cells treated with APOE-mCh conditioned medium were also analyzed by qPCR. Quantitative results are mean±s.e.m. *P<0.05, **P<0.01, ***P<0.001; ns, not significant (one-way ANOVA with Tukey–Kramer test).

