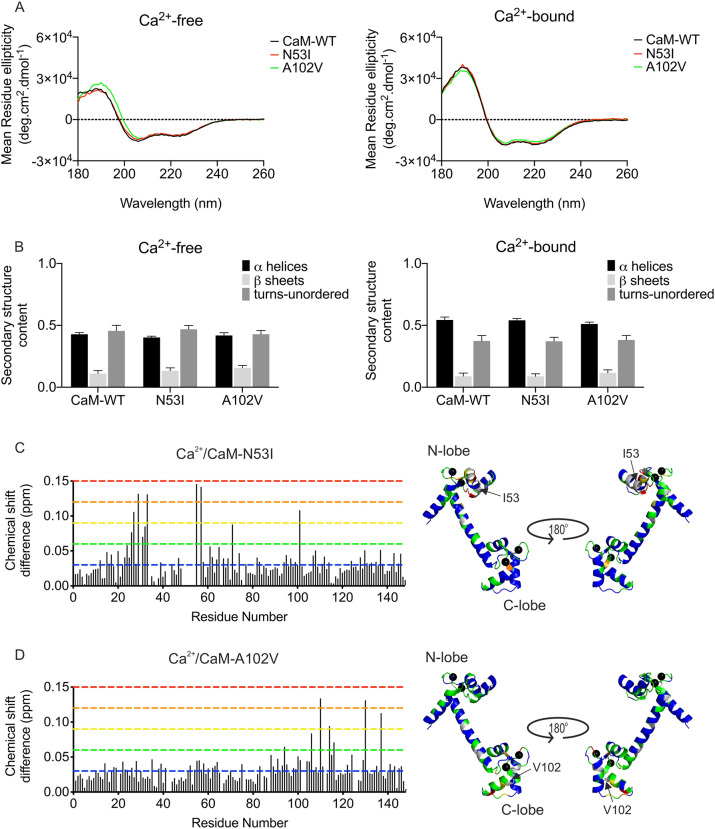
Fig. 2.
CPVT-associated CaM variants N53I and A102V do not show altered secondary structure but induce local structural changes in CaM. Analysis of the secondary structures of CaM-WT and mutants (5 µM) using circular dichroism spectroscopy. (A) Circular dichroism spectra were obtained in the presence of 1 mM EGTA (left panel) or 1 mM CaCl2 (right panel). Data are representative traces from experiments performed in triplicate. (B) Protein secondary structure content estimated using the CDSSTR method (Dichroweb, reference set 3). Data are mean±s.e.m. Experiments were performed at 20°C, in triplicate. Differences between the three groups were determined using two-way ANOVA with the Sidak's post-hoc test and CaM-WT as control. No significant differences were found. (C,D) Histogram of chemical shift differences observed between CaM-WT and CaM-N53I (C) or CaM-A102V (D) (left panels). Data shown are from single NMR experiments. Chemical shift data were normalised between minimum and maximum values, and converted into a colour spectrum of five unique colours (key, blue for smallest shifts through to red for largest shifts; shown as dashed lines in histograms), which were then mapped onto the CaM crystal structure (PDB, 2CLL) (right panels). Unassigned peaks are shown in grey, and Ca2+ ions as black spheres. Chemical shift differences were expressed in ppm as Δδ=[(ΔH)2+(0.15ΔN)2]1/2. Residues with chemical shifts equal to or less than 0.03 ppm were deemed non-movers (blue); the remaining shifts were categorised into colour by increasing margins of 0.03 ppm (0.03-0.06 ppm, green; 0.06-0.09 ppm, yellow; 0.09-0.12 ppm, orange; and 0.12-0.15 ppm, red). Shift differences were mapped onto the structure of Ca2+/CaM using PyMOL to illustrate a surface representation of the chemical shift derivations.

