Fig. 4.
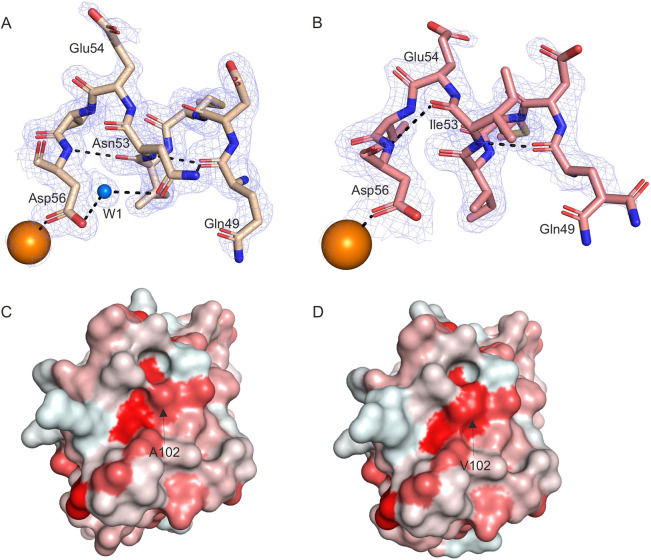
Ca2+/CaM–RyR23583-3603 peptide complexes show differences in the H-bond network at the site of mutation, and increased hydrophobicity. (A,B) Ca2+/CaM-WT–RyR23583-3603 with Ca2+/CaM-WT in beige (A) and Ca2+/CaM-N53I–RyR23583-3603 with Ca2+/CaM-N53I in salmon (B). Ca2+ ions are shown as orange spheres and water molecule as a blue sphere. Interactions are represented by black dashed lines, with residues represented as sticks and electron density as mesh. (C,D) Comparison of the hydrophobicity of the surface areas of Ca2+/CaM-WT–RyR23583-3603 (C) and Ca2+/CaM-A102V–RyR23583-3603 (D). CaM is shown in surface representation, with surface coloured from white to red based on the Eisenberg hydrophobicity scale (Eisenberg, 1984). White is less hydrophobic than red. Arrows indicate the areas of the Ala102 and Val102 residues. Images were generated using PyMOL software.

