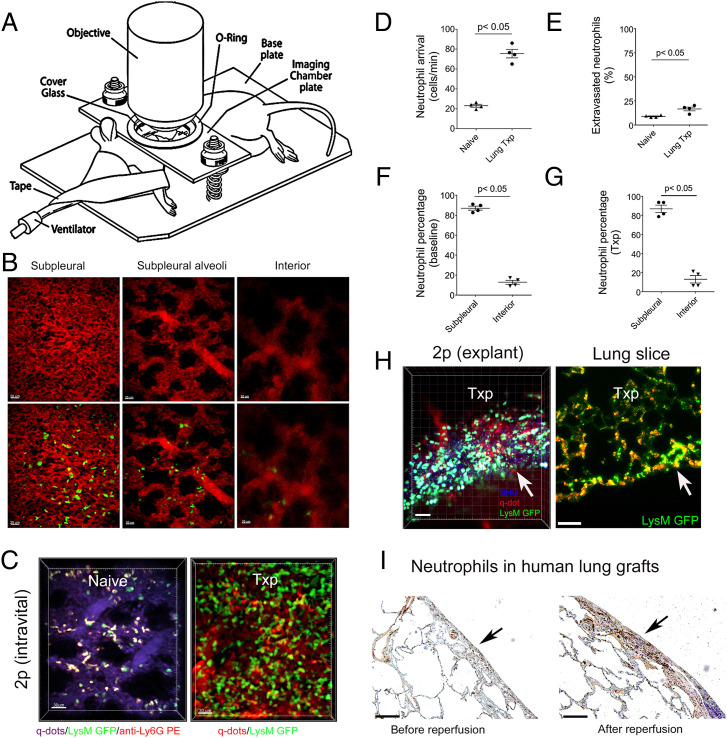
Fig. 1.
Neutrophils accumulate in subpleural capillaries at baseline and after ischemia reperfusion injury. (A) Diagram depicting setup of mouse for intravital two-photon imaging. (B) Representative two-photon images of vessels above (Left) (10 μm) and below (Right) (80 μm) subpleural alveoli (Middle) (25 μm) in lungs of naïve B6 LysM-GFP mice. The Top panel depicts vessels after injection of quantum dots (red), and the Bottom panel shows vessels (red) and LysM-GFP+ cells (green) (Scale bars: 20 μm). (C) Two-photon images of neutrophils in subpleural capillaries of (Left) lungs of naïve B6 LysM-GFP mice and (Right) reperfused B6 lung grafts that were subjected to 60 min of cold storage 2 h after transplantation into syngeneic B6 LysM-GFP hosts. In naïve lungs, neutrophils are green with a red ring after labeling with intravenous anti-Ly6G antibody (PE). Pulmonary vessels are labeled after intravenous injection of quantum dots (Left: purple; Right: red) (Scale bars: 30 μm). (D) No. of neutrophils arriving in pulmonary arterioles per minute and (E) percentage of extravasated neutrophils in naïve B6 lungs versus B6 lung grafts 2 h after transplantation into syngeneic recipients. Percentage of neutrophils in subpleural versus interior perialveolar capillaries in (F) lungs of naïve B6 LysM-GFP mice and (G) reperfused B6 lung grafts that were subjected to 60 min of cold storage 2 h after transplantation into syngeneic B6 LysM-GFP hosts. (H) Two-photon imaging (Left) and immunofluorescent staining (Right) of neutrophils (green) of tissue slices of B6 lung grafts that were subjected to 60 min of cold storage 2 h after transplantation into syngeneic B6 LysM-GFP hosts. The arrow points to pleural surface (Scale bars: Left 30 μm, Right 100 μm). (I) Neutrophil staining (antineutrophil elastase) in human lung grafts before (Left) and 2 h after reperfusion (Right). The arrow points to pleural surface (Scale bars: 100 μm). The data in (D–G) represent the mean ± SEM (n = 4).

