Fig. 3.
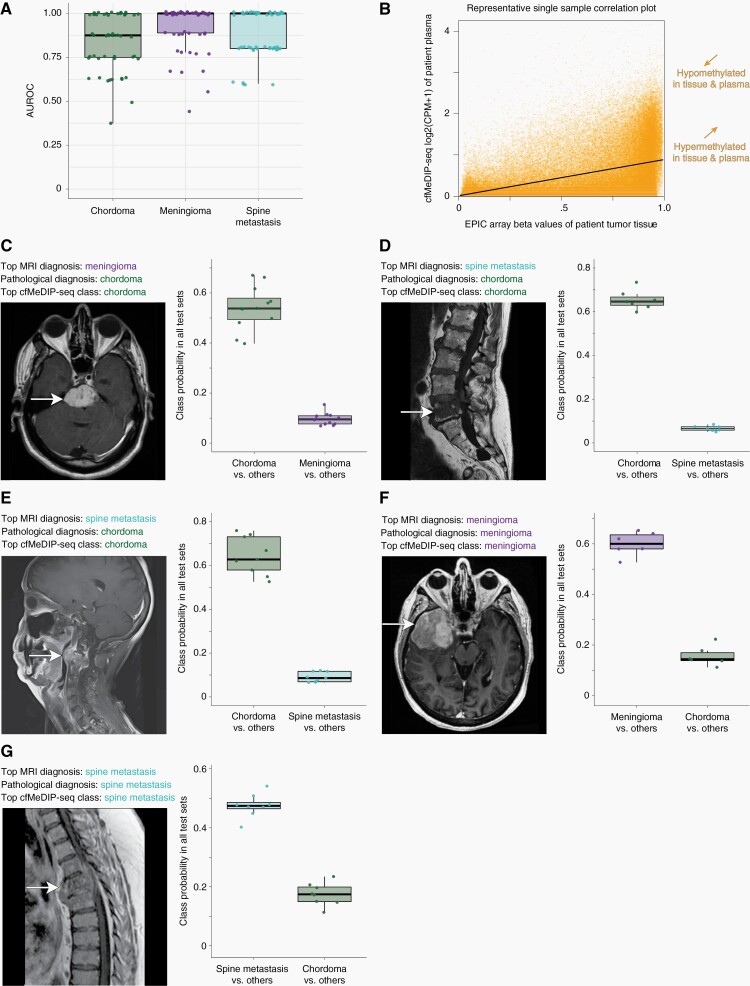
Plasma cfDNA methylomes distinguish chordomas from other clinical differential diagnoses of meningiomas and spine metastases while also detecting chordoma subtype signatures. A, Boxplots of AUROC values across 50 iterations of one-class-versus-other models show accurate discrimination of chordomas from differential diagnoses. Mean AUROCs (95% CIs) are 0.84 (0.52–1.00), 0.92 (0.66–1.00), and 0.88 (0.62–1.00) for chordomas, meningiomas, and spinal metastases, respectively. B, Representative scatterplot showing the correlation between tumor tissue methylation beta values and plasma cfMeDIP-seq window CPM values within paired samples from a single chordoma patient. C–E, Representative clinical cases of neuropathologically-diagnosed chordomas where preoperative neuroimaging and clinical factors suggested diagnoses of (C) a skull-base meningioma or (D–E) spine metastases. The top cfMeDIP-seq model class was that of chordoma for all three cases, based on class probabilities in model testing sets, and consistent with the neuropathological diagnosis. F–G, Representative cases of clinical differential diagnoses, including both meningioma (F) and spine metastasis (G) patients, confirmed by histopathology and accurately identified by plasma methylomes according to testing set class probability data. Boxplot central bars indicate medians, boxes show upper and lower distribution quartiles, and whiskers extend across the 1.5× interquartile range. AUROC, area under the receiver operating characteristic curve; cfMeDIP-seq, cell-free methylated DNA immunoprecipitation and high-throughput sequencing; CPM, count per million; MRI, magnetic resonance imaging.

