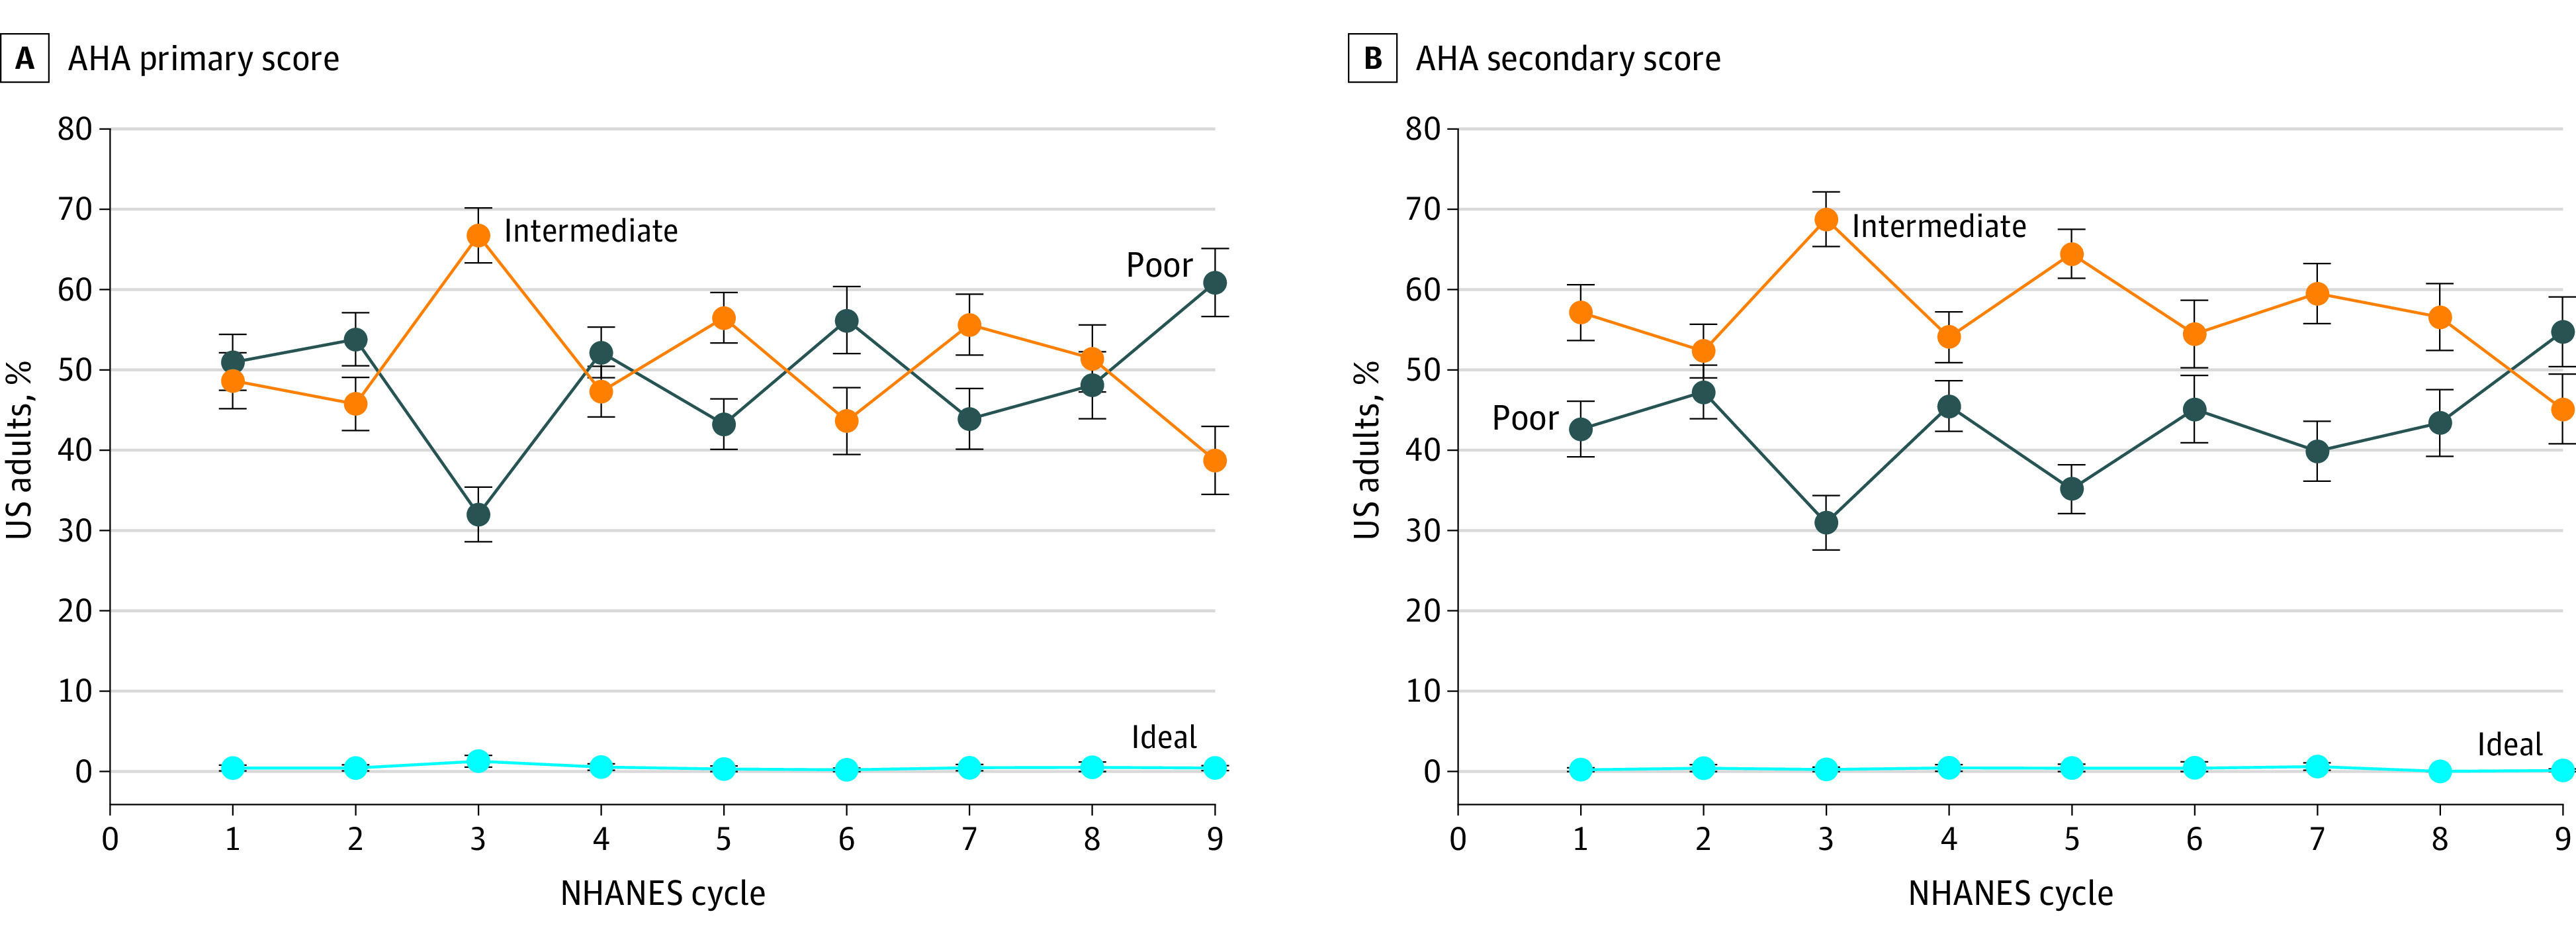
Figure 1. Trends in Estimated Proportions of US Adults Aged 65 Years or Older With Poor, Intermediate, or Ideal Diet Quality, National Health and Nutrition Examination Survey (NHANES) Cycles, 2001-2018.

AHA indicates American Heart Association. Error bars indiate 95% CIs.
