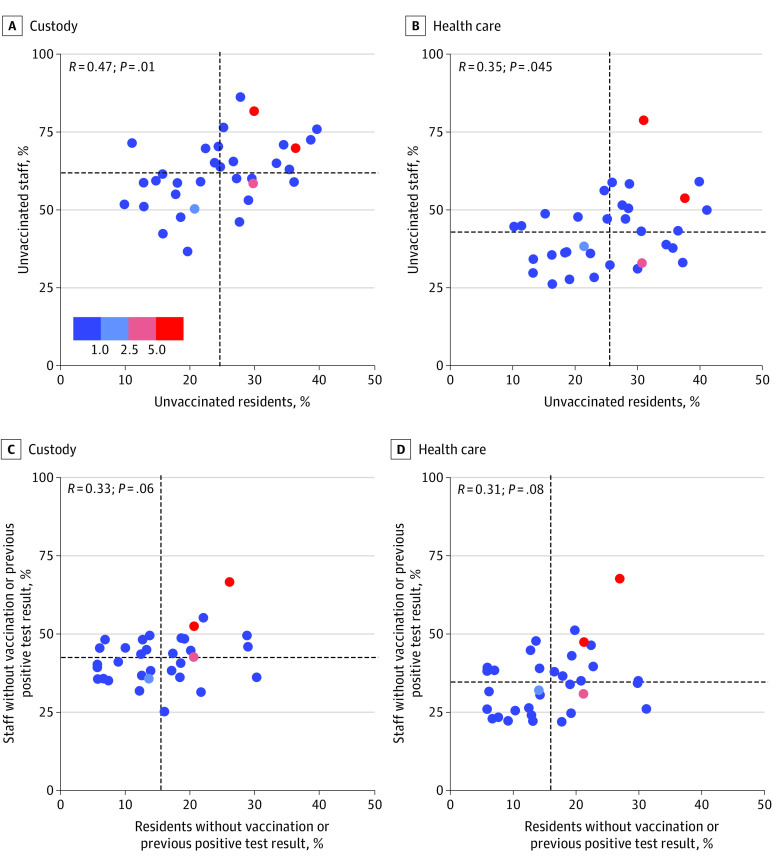
Figure 2. Percentage of Custody Staff, Health Care Staff, and Residents of California State Prisons Who Were Unvaccinated and Did Not Previously Test Positive for SARS-CoV-2 by Prison on June 30, 2021, and Cumulative Incidence of Infection Among Residents From July 1, 2021, Through September 25, 2021.
Proportions of unvaccinated custody and health care staff and residents (A and B) and proportions of unvaccinated custody and health care staff and residents who also had no previous positive test result (C and D) as of June 30, 2021, at each of 33 California Department of Corrections and Rehabilitation prisons. Cumulative incidence for residents was based on total incidence of SARS-CoV-2 infection between July 1, 2021, and September 25, 2021. Vaccinated indicates receipt of 1 or more doses of any COVID-19 vaccine, and not vaccinated indicates receipt of 0 doses of vaccine. Each point on the graph represents an individual prison. The horizontal and vertical dashed lines represent the institutional mean. The color key is in percentage points.

